
Figure 3.
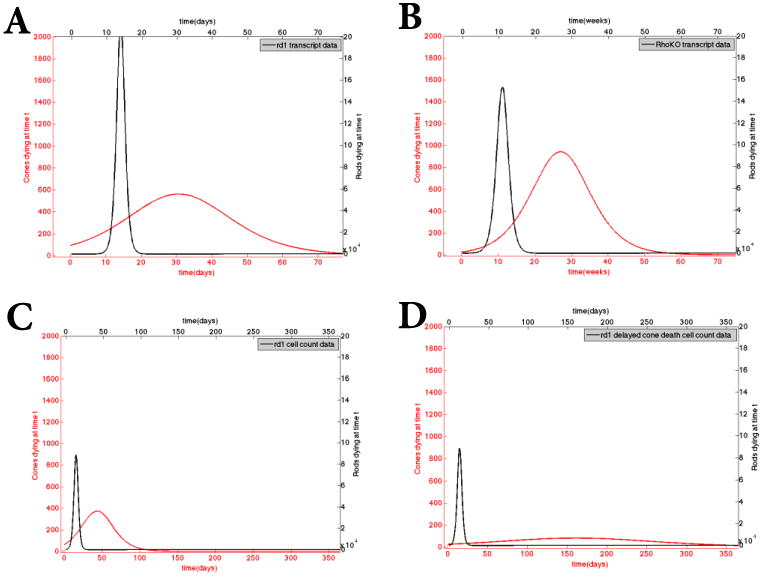
Calculated death kinetics using the sigmoidal fits of the datasets. These curves are obtained by taking the first derivative of the sigmoidal curves obtained in Figure 2. Top panels: Rod (in black) and cone (in red) death kinetics based on the transcript data from the rd1 (Panel A) and the Rho-KO (Panel B) model. Panel C: Rod (in black) and cone (in red) death kinetics based on rd1 cell count data. Panel D: rod curve (in black) is the same as in Panel C but the cone curve corresponds to delayed cone death kinetics due to improved nutrient uptake. In all cases, the largest proportion of the rod death precedes that of cone death. The plotted cone death kinetics from the sigmoidal fit appear to begin sooner than that of the rods but this is simply an artifact of the sigmoidal fit of the curve through the data.