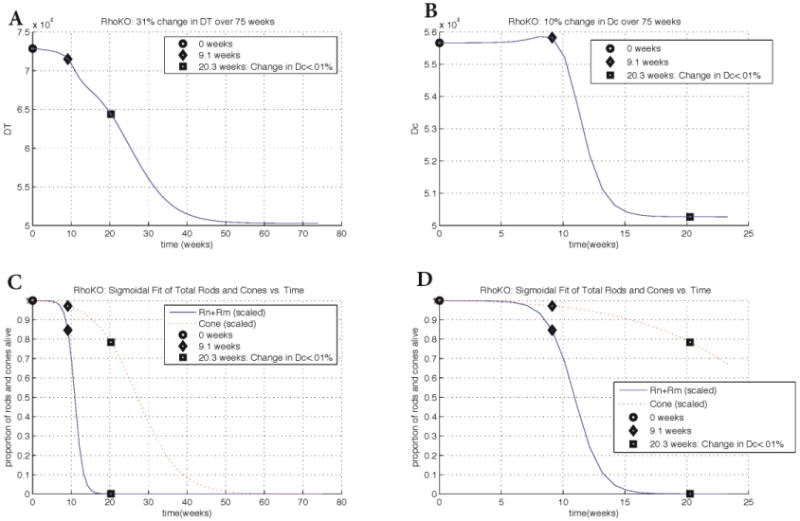
Figure 5.

Changes in key quantities DT and Dc for Rho-KO transcript data. Key points in time are marked on every graph. Panel A: change in DT vs. time. The key points of 9.1 weeks and 20.3 weeks correspond to the beginning of rod degeneration and when the change in Dc is less than 0.01%, respectively. Panel B: change in Dc vs. time. The graph of Dc shows a 10% overall change whereas the change in DT shows a 31% overall change. Panels C and D: scaled rod (solid curve) and cone (dotted curve) populations vs. time. Populations at every point were divided by the population at time 0, i.e., the first value. Plots in Panel D are zoomed in with respect to the horizontal axis. The input parameters and variables to (3) were determined from the best maximum likelihood estimator of 20,000 realistic-valued sample points using Latin Hypercube Sampling. Non-time dependent parameter values are [μn, μs, μc, Γ, an, as, ac, βn, βs, k, dn, ds, γ]=[0.103, 0.0994, 0.119, 4.93, 4.909e-6, 5.24e-6, 5.12e-6, 2.50e-8, 2.29e-8, 6.37e-5, 1.91e-9, 3.69e-9, 7.54e-6].
