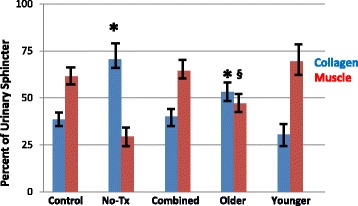
Fig. 3.

Sphincter muscle/collagen content in the older versus younger monkeys. This figure depicts the percent of urinary sphincter complex that is muscle versus collagen as determined from cross-sectional areas of the sphincter stained with Mason’s Trichrome. These values are shown for: the “Control” group (no ISD/no treatment); ISD/no treatment “No Tx” group; the “Combined” (ISD/skMPC treatment group); the “Younger” (age 5–8 years) and the “Older” (age 13–15 years) groups. * p < 0.05 vs. Control. § p < 0.05 vs. Younger. Values are mean ± SEM. The statistical significance markers reflect changes in both the collagen and muscle content
