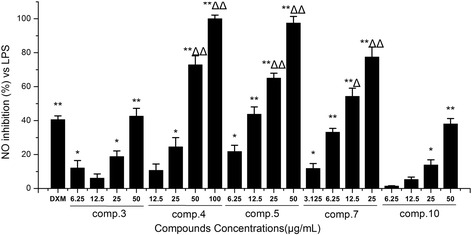
Fig. 4.

Effects of isolated compounds (3–5, 7 and 10) on the production of NO in LPS-induced RAW264.7 macrophages. Cells were pre-treated for 2 h with indicated concentrations of (3–5, 7 and 10) and then stimulated with LPS (final concentration 1 μg/mL) for another 24 h. Data are expressed as mean ± S.D. Of three independent experiments. * p < 0.05 and ** p < 0.01 versus the LPS group, △p < 0.05 and △△p < 0.01 versus the DXM group
