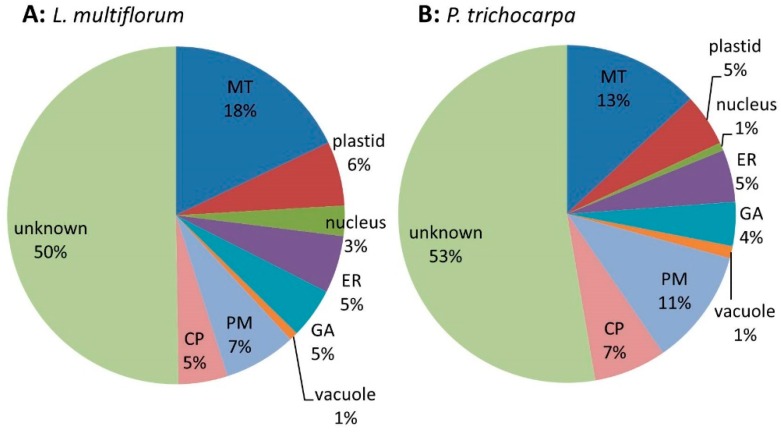
Figure 3.
Pie chart of the expected sub-cellular locations of (A) the 619 proteins from L. multiflorum and (B) the 260 proteins from P. trichocarpa from which quantitative data were obtained. The pie charts show a similar distribution of proteins in the different sub-cellular compartments, i.e., mitochondria (MT), endoplasmic reticulum (ER), Golgi apparatus (GA), plasma membrane (PM), vacuole and cytoplasmic (CP).

