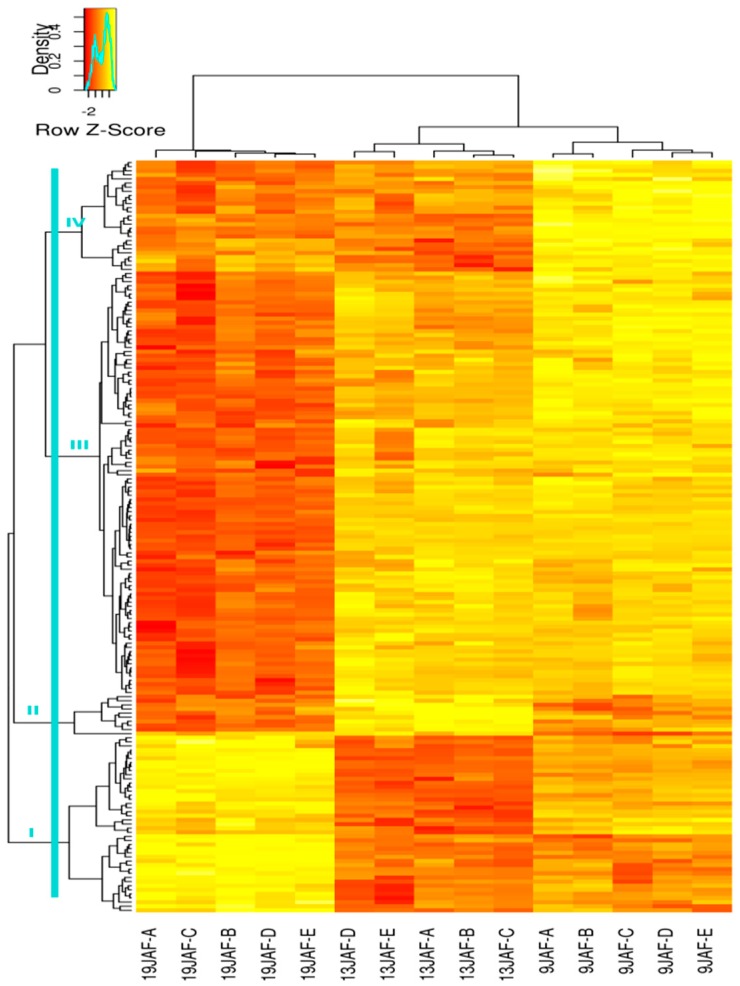
Figure 4.
The heat map of the CWPs identified at the three developmental stages of the B. distachyon grain. The 5 biological replicates are represented for each stage. The variation in the protein abundance is shown by a colour code ranging from yellow (the most abundant proteins) to red (the less abundant proteins). The blue line represents the extraction level of the clusters. Cluster numbers (from I to IV) are indicated on the heat map.

