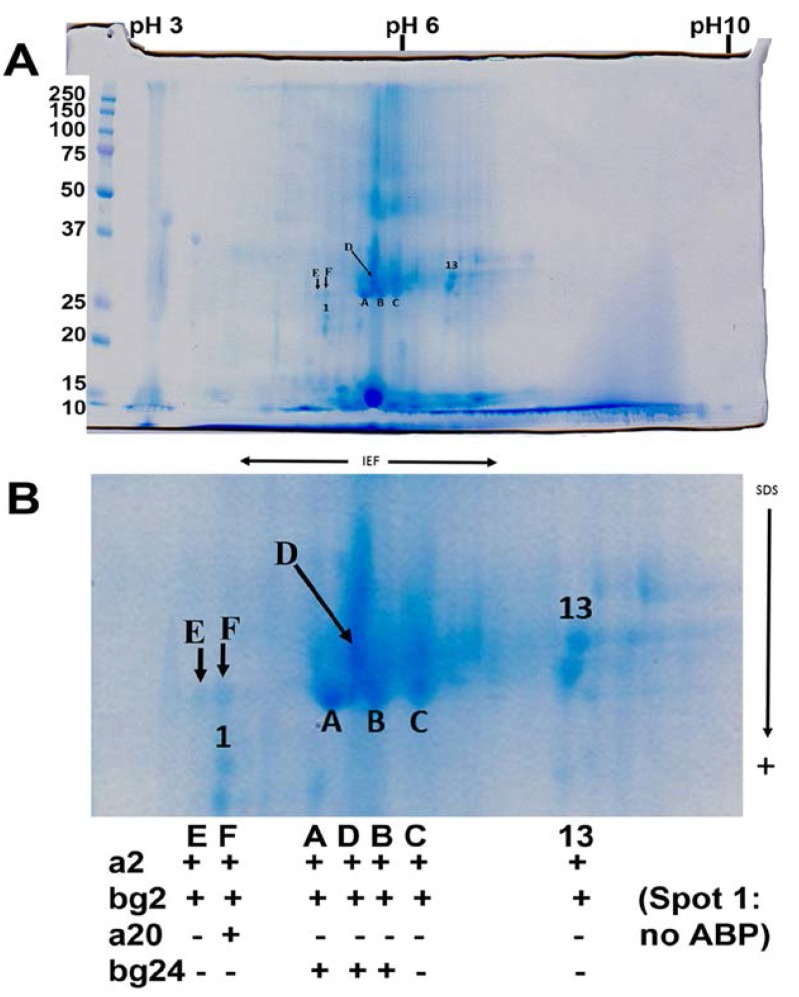
Figure 3.
Two-dimensional gel (A), with center enlarged (B) showing excised spots and their ABP subunit content. The spots were sampled across a region of divergent isoelectric points but very similar molecular weights and these were subsequently excised and digested with trypsin for analysis by LC-MS/MS (see results in Figure 4). A + means the subunit was present, and a – means it was absent.

