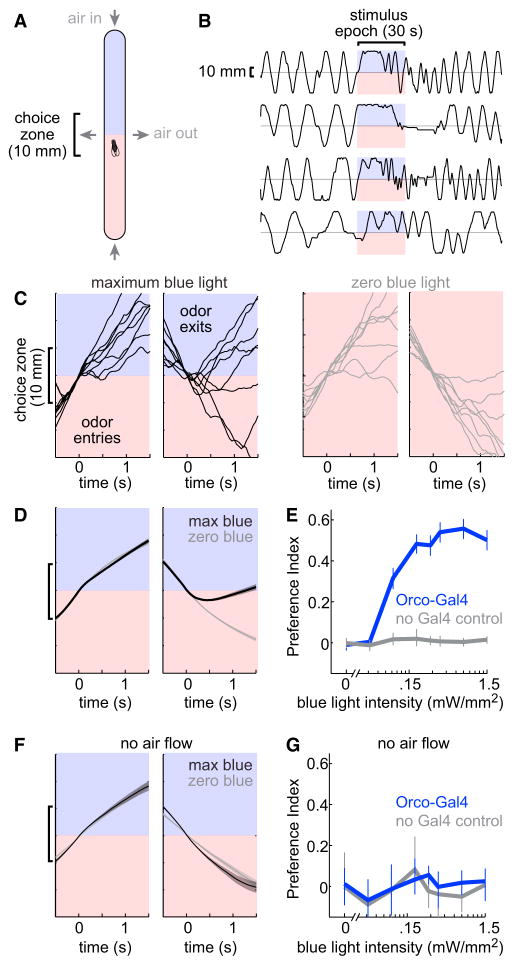
Figure 2. A High-Throughput Assay for Measuring Behavioral Responses to Optogenetic Fictive Odors.
(A) Behavioral chamber. Air flowed in at the ends and out through vents at the midpoint. A fly encountered blue light in one half of the chamber. In the other half, the fly was illuminated with red light (always 1.5 mW/mm2). In trials where the blue light intensity was less than maximum (i.e., <1.5 mW/mm2), red light was added to the blue zone so that total intensity at all locations in all trials was 1.5 mW/mm2.
(B) Example trajectories of four flies. Each trajectory shows one fly’s position along the long axis of the chamber over time. Flies express ChR in most ORNs (under Orco-Gal4 control).
(C) Trajectories aligned to when the fly crossed the chamber’s midpoint (time = 0), grouped by heading direction at that point. Flies express ChR under Orco-Gal4 control. Black: maximum blue light intensity (1.5 mW/mm2). Gray: zero blue light intensity. Note that exiting the fictive odor tends to produce abrupt reversal, while entering the fictive odor has little effect.
(D) Same as (C) but averaged across all trajectories from all flies of this genotype. Mean trajectories are overlaid for maximum-blue and zero-blue trials. Shaded bands represent SEM across flies (n = 72 flies).
(E) Mean PI versus blue light intensity (±bootstrapped 95% confidence intervals). In flies expressing ChR under Orco-Gal4 control, PI increases with light intensity. In control flies that lack Gal4, blue light does not affect PI (n = 72 flies for Orco-Gal4, 64 for no Gal4). The two genotypes are significantly different (p < 0.0001, see Supplemental Experimental Procedures for statistical test).
(F and G) Same as (D) and (E) but for experiments where air flow was turned off (n = 32 flies for Orco-Gal4, 24 for no Gal4). Here there is no preference. There is no statistical difference between the two genotypes in the relationship between PI and blue light intensity (p = 0.86).

