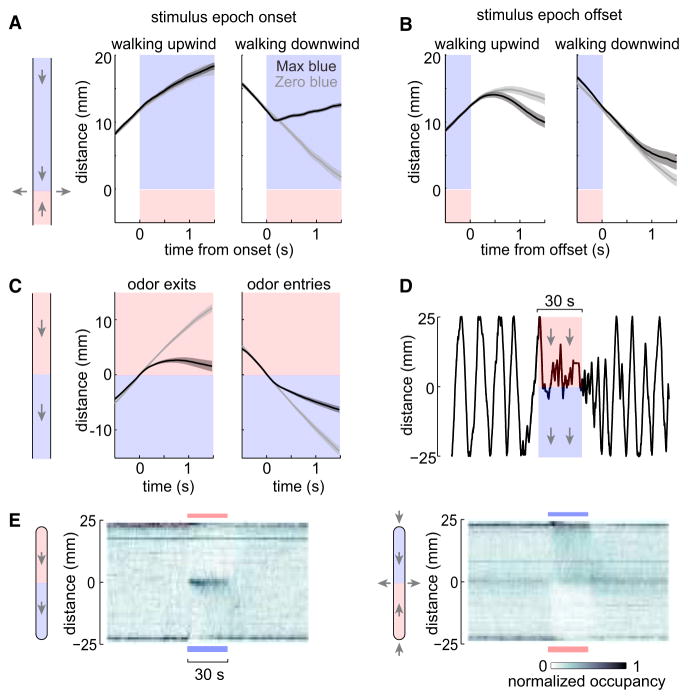
Figure 3. Fictive Odor Onset Causes Upwind Turns, and Offset Causes Downwind Turns.
(A) Mean trajectories aligned to the onset of the stimulus epoch, ±SEM across flies (n = 72 flies). We included all the trajectories where, at stimulus epoch onset, the fly was positioned 8–16 mm from the blue end of the chamber. Left: flies walking upwind at fictive odor onset showed little deviation from the zero-blue laser controls. Right: flies walking downwind at fictive odor onset tended to reverse and walk upwind more often than the zero-blue laser controls. We assessed statistical significance by measuring position over the last half-second of these trajectories; position was not significantly different on the left (p = 0.90) but was highly significant on the right (p < 0.0005). In all panels of this figure, flies express ChR under Orco-Gal4 control.
(B) Same as (A), but aligned to the end of each stimulus epoch. Flies walking upwind tended to reverse and walk back downwind more often than did zero-blue laser controls (p = 0.03). For flies walking downwind, there is no significant difference from the zero-blue laser controls (p = 0.46). The four p values associated with this figure were corrected for multiple comparisons using the Bonferroni-Holm procedure (m = 4 tests).
(C) Rather than flowing air into the chamber at both ends and out at the mid-point (as in all other experiments), we instead flowed air in one direction through the entire chamber. The fictive odor was placed on the downwind side. Mean trajectories aligned to fictive odor entry or exit show that flies tended to turn after downwind entries and also after upwind exits (n = 32 flies, ±SEM across flies).
(D) Example single-fly trajectory from an experiment like that in (C). Arrows show air flow direction. Note that the fly repeatedly re-crosses the fictive odor boundary.
(E) Histograms of occupancy over time, averaged over all flies tested in each condition. Left: in the modified chamber with one-way air flow, flies reverse in response to blue light entry and also blue light exit, causing them to remain mostly in the mid-point of the chamber. Right: in the standard chamber with air flowing in at both ends, flies accumulate on the side with the fictive odor.

