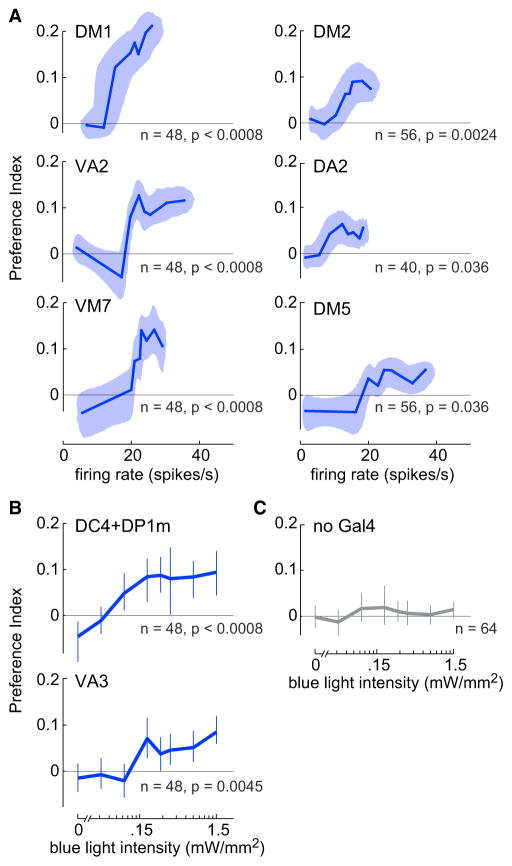
Figure 4. Attraction Evoked by Individual ORN Types.
(A) Mean PI versus ORN spike rate, for the six “attractive” ORN types we were able to record from (firing rate data are the steady-state firing rates from Figure 1C). Shaded bands show bootstrapped 95% bivariate confidence intervals. p values represent comparisons with control flies that do not express ChR (“no Gal4” control), after correction for multiple comparisons using the Bonferroni-Holm procedure (m = 8 tests, see Supplemental Experimental Procedures).
(B) Mean PI (±bootstrapped 95% confidence intervals) versus blue light intensity. Included here are data for the two ORN types that we were not able to record from.
(C) Same as (B) for control flies (no Gal4). Data are reproduced from Figure 2E.

