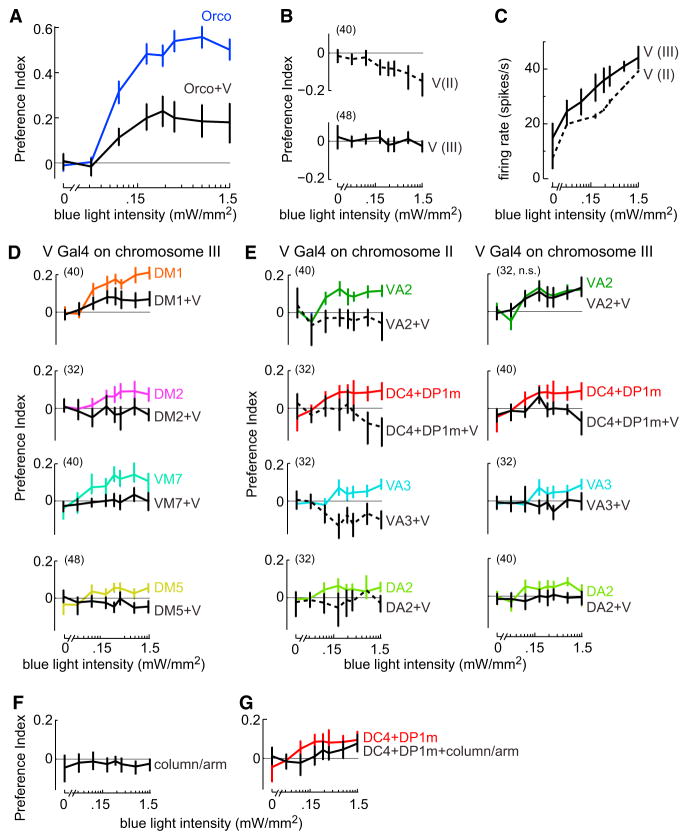
Figure 7. Activation of Repulsive ORNs Can Suppress Attraction.
(A) A potent anti-attractive effect of glomerulus V. Mean PI versus blue light intensity (±bootstrapped 95% confidence intervals). Blue: response to activating most ORNs (under the control of Orco-Gal4), reproduced from Figure 2E. Black: activating Orco+ ORNs together with V ORNs (n = 32). The combination response is significantly smaller than the response to Orco+ ORNs alone (p < 0.0001, see Supplemental Experimental Procedures for statistics). The V Gal4 line used here was the insert on chromosome III (Table S2).
(B) Activating V alone. Mean PI versus blue light intensity (±bootstrapped 95% confidence intervals, n values in parentheses). In experiments using the V Gal4 line on chromosome II (top, dashed line), there is a significant difference (p < 0.001) versus control flies (“no Gal4” control from Figure 2E). In experiments using the V Gal4 line on chromosome III (bottom, solid line), there is no significant difference versus control. Tests are corrected for multiple comparisons (m = 2 tests).
(C) V ORN firing rate versus blue light intensity (mean ± SD across cells, n = 6 and 6 for the Gal4 lines on II and III). Note that both spontaneous and light-evoked firing rates are higher for the Gal4 line on chromosome III, but the behavioral effects for this line are generally weaker, suggesting that there is more central adaptation in this line (Figure S4).
(D and E) Combinations with individual attractive glomeruli. Mean PI versus blue light intensity (±bootstrapped 95% confidence intervals). Colored traces: individual attractive glomeruli, re-plotted from Figure 4. Black: combinations with V (n values in parentheses). All plots have the same axis ranges. The experiments in (D) used the V Gal4 line on chromosome III, and in all cases the effect of the V Gal4 line was statistically significant (p < 0.05). The experiments in (E) used both the V Gal4 line on chromosome II (left, dashed black lines) and the V Gal4 line on chromosome III (right, solid black lines). In all but one case, the effect of V was statistically significant (p < 0.05). In the case of the one exception (VA2 + V Gal4 line on chromosome III, “n.s.”), the alternative V Gal4 line showed a significant effect. Tests are corrected for multiple comparisons (m = 12 tests).
(F) Activating column/arm ORNs alone produces small but significant repulsion compared to “no Gal4” control flies (from Figure 2E; p < 0.05; whiskers are bootstrapped 95% confidence intervals, n = 56 for the combination genotype).
(G) Combining column/arm ORNs with DC4+DP1m ORNs significantly reduces behavioral attraction relative to DC4+DP1m alone (from Figure 4B; p < 0.05; whiskers are bootstrapped 95% confidence intervals, n = 32 for the combination genotype).

