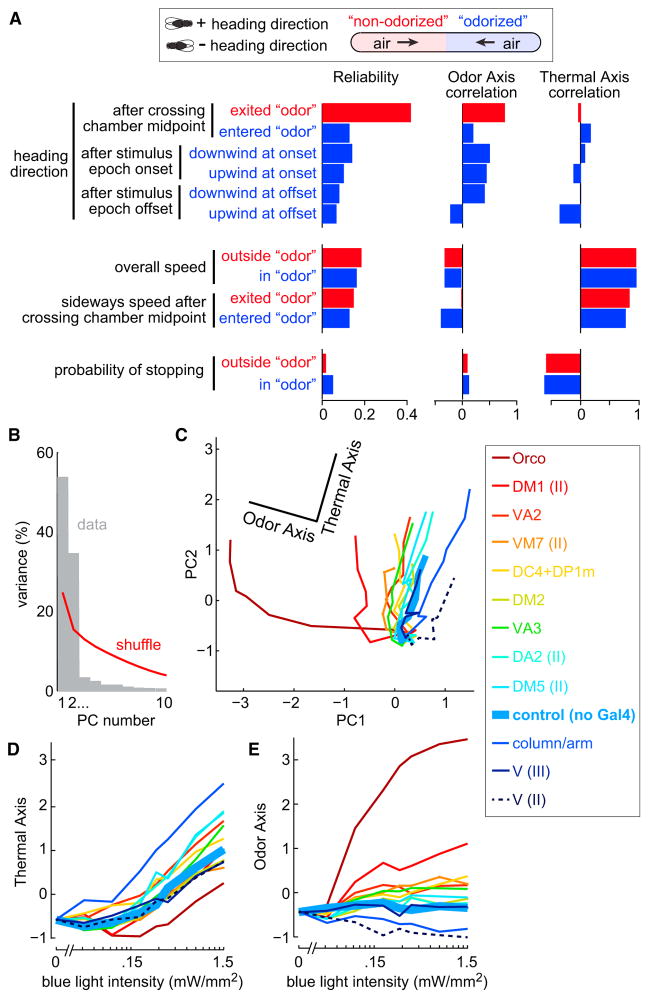
Figure 8. Flies Respond to Fictive Odors with Graded Recruitment of a Single Behavioral Program.
(A) Twelve behavioral variables color coded according to whether they are measured inside or outside the “odorized” zone (blue or red). Heading variables are positive when the fly faces the “odorized” end and negative when the fly faces the “non-odorized” end. Heading variables measured after stimulus epoch onset/offset are further divided according to whether the fly was facing upwind or downwind at onset/offset. Shown for each variable is a Reliability score (see Supplemental Experimental Procedures); Reliability = 0 when there is no systematic effect of blue light intensity or genotype, and 1 if the behavior is predictable based on blue light intensity and/or genotype. Reliability is statistically significant for all variables except one (probability of stopping outside “odor”). Also shown is the correlation with the Odor Axis and the Thermal Axis.
(B) Fraction of the explainable variance accounted for by the first 10 principal components (PCs) of this 12-dimensional space. Red line shows the upper 95% confidence interval of the result when PCA is performed after shuffling the genotype and light intensity labels. Only the first two PCs are statistically significant, and together they account for 88% of the variance. Genotypes included are shown in inset at right. Similar results were obtained if Orco-Gal4 was omitted, or if all combination genotypes were included (see Supplemental Experimental Procedures).
(C) Behavioral data in the space defined by PC1 and PC2. Genotypes cluster at zero intensity and diverge as light intensity increases. Behavior in control flies varies along only one axis in this space (the Thermal Axis). The orthogonal axis (the Odor Axis) accounts for most of the variation that depends on genotype. Genotypes are color coded by PI (Figures 4 and 7). Roman numerals specify the chromosome of the Gal4 line used (Table S2).
(D) Projection of the data onto the Thermal Axis, versus blue light intensity.
(E) Projection of the data onto the Odor Axis, versus blue light intensity.

