
Fig. 2.
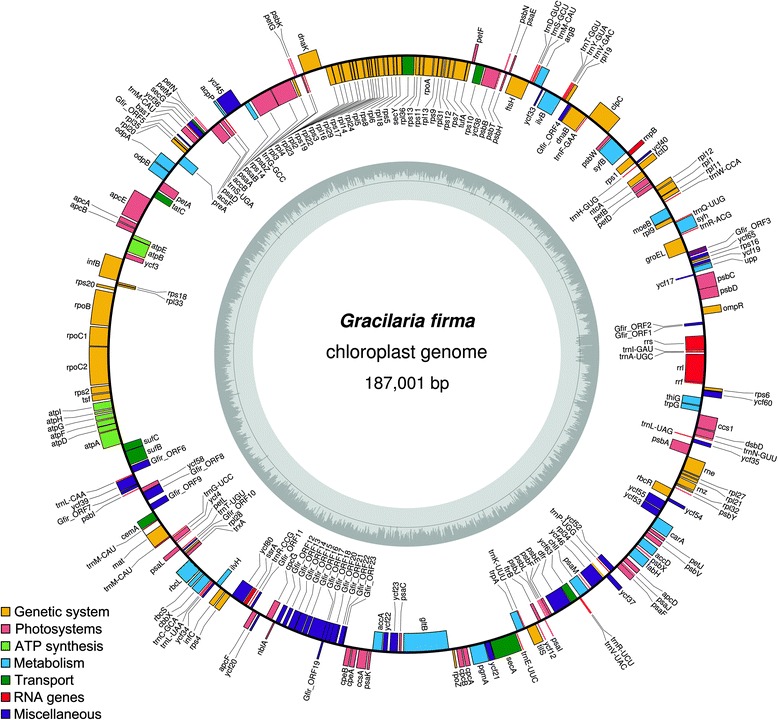
Chloroplast genome map of Gracilaria firma. Genes present inside the circle are transcribed in a clockwise direction whereas those outside counter clockwise. The bar graphs on the inner circle reveal GC content in dark grey with the 50% threshold line. The overall GC content of the genome is low, but there is an increase in GC content corresponding to the region encoding for rRNA genes. The annotated genes are color-coded according to the functional categories listed in the legend