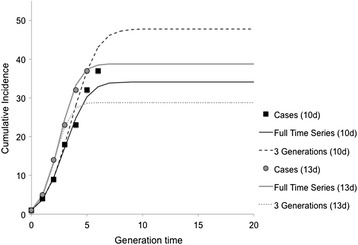
Fig. 5.

Modeled cumulative incidence based on fitting the IDEA model to three epidemic generations assuming a longer generation time than the base case scenario (10 or 13 days). Squares represent the observed cumulative incidence by generation assuming a 10-day generation time and circles represent a 13-day generation time. Solid lines represent the model fit to the entire time series (black = 10 days, and gray = 13 days). The dashed lines represent the model fit based on only three outbreak generations (prior to the outbreak peak). In this case, curves generated from data early in the outbreak are less representative of those resulting from fitting to the entire time series
