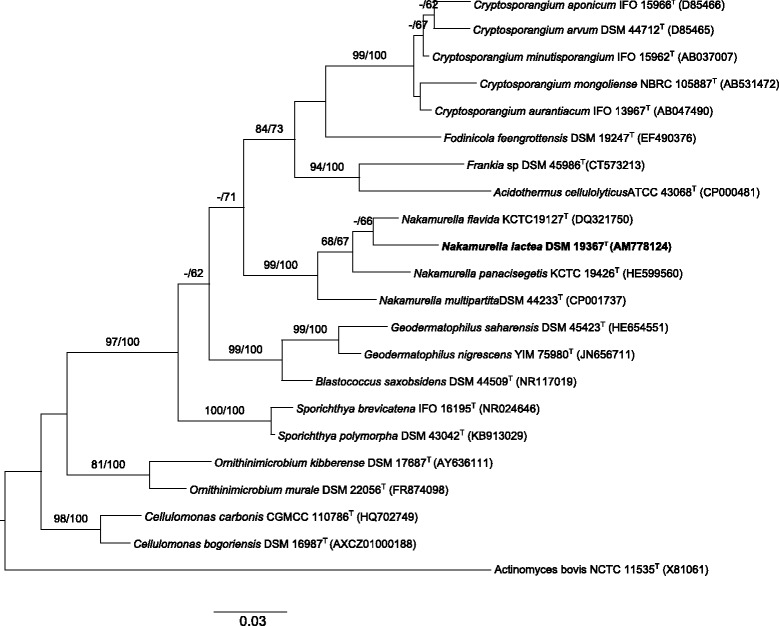
Fig. 2.

Maximum likelihood phylogenetic tree of N. lactea DLS-10T and related type strains within the related families constructed under the GTR + GAMMA model and rooted using Actinomyces bovis NCTC 11535T as outgroup. The branches are scaled in terms of the expected number of substitutions per site (see size bar). Support values from maximum-likelihood (left) and maximum-parsimony (right) bootstrapping are shown above the branches if equal to or larger than 60%
