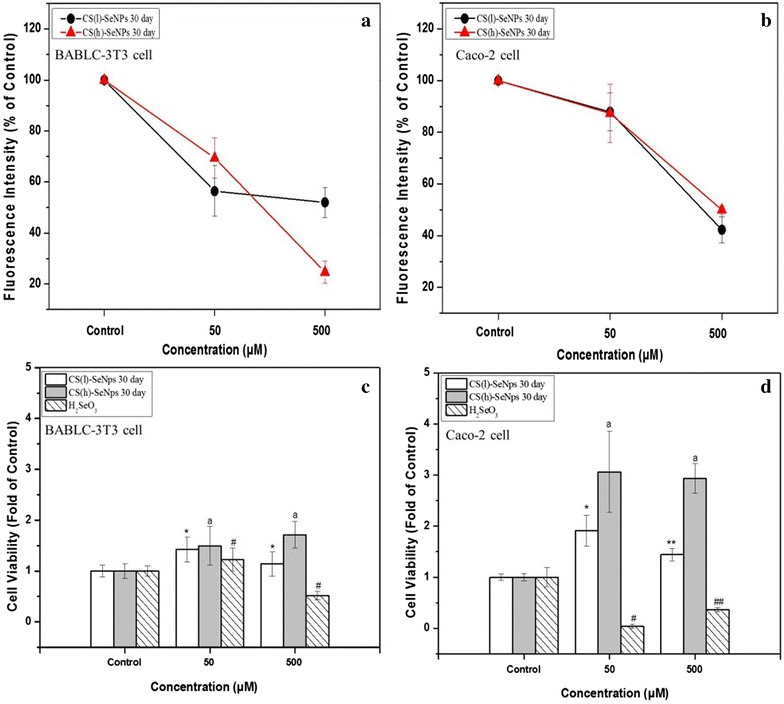
Fig. 4.

Comparison of the CS-SeNPs effects on ROS accumulations and cell viabilities in cell lines. a, c BABLC-3T3 cell, b, d Caco-2 cell lines. The different markers denote the significant mean difference at p < 0.05

Comparison of the CS-SeNPs effects on ROS accumulations and cell viabilities in cell lines. a, c BABLC-3T3 cell, b, d Caco-2 cell lines. The different markers denote the significant mean difference at p < 0.05