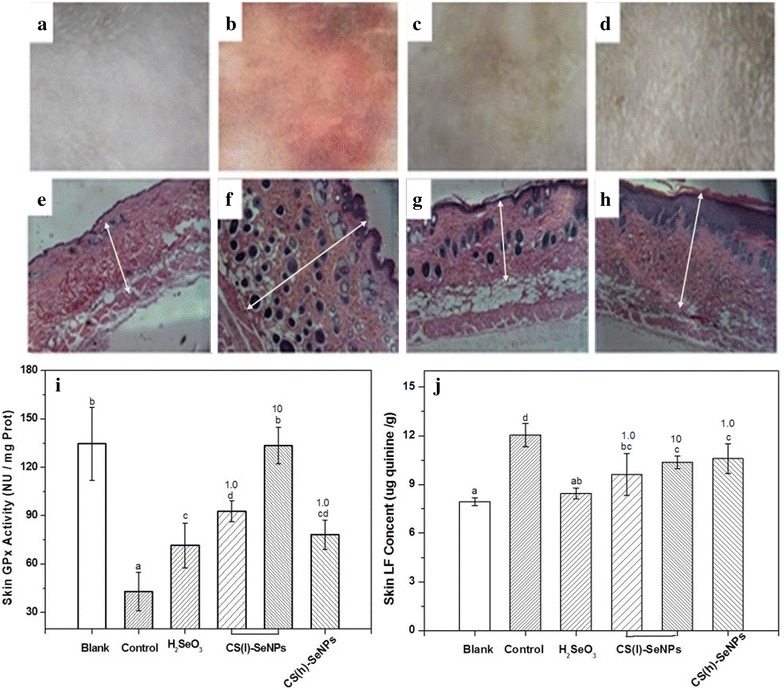
Fig. 6.

Optical micrographs of the mice skin and comparison of the GPx (i) and LF levels (j) after UV-radiation. a–d skin surface; e–h skin cross section. a, e unirradiated group; b, f UV-irradiated and treated with blank lotion; c, g UV-irradiated and treated with the CS-SeNPs; and d, h UV-irradiated and treated with H2SeO3. H&E stain, 400× magnification, the thickness of the granular layers is marked with the double-headed arrows. The different letter markers denote the significant mean difference at p < 0.05
