
Fig. 4.
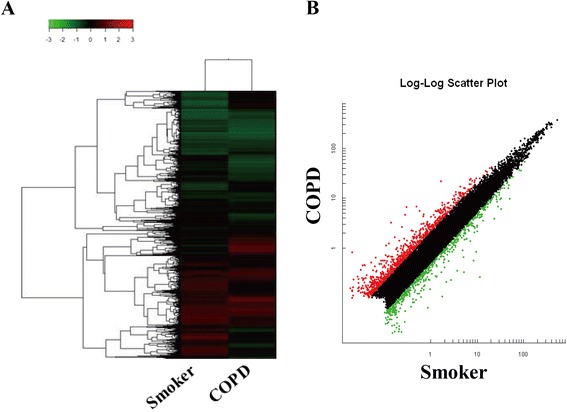
Hierarchical clustering and scatter plot result of differentially expressed mRNAs in PBMCs from smokers and COPD patients. a Hierarchical clustering image of mRNA expression of pooled RNA samples from PBMCs of COPD patients compared to smokers without airflow limitation. b Scatter plot of mRNA expression of PBMCs of COPD patients compared to smokers without airflow limitation. Red and green colored dots represent up- and down- regulated mRNAs in scatter plot, respectively