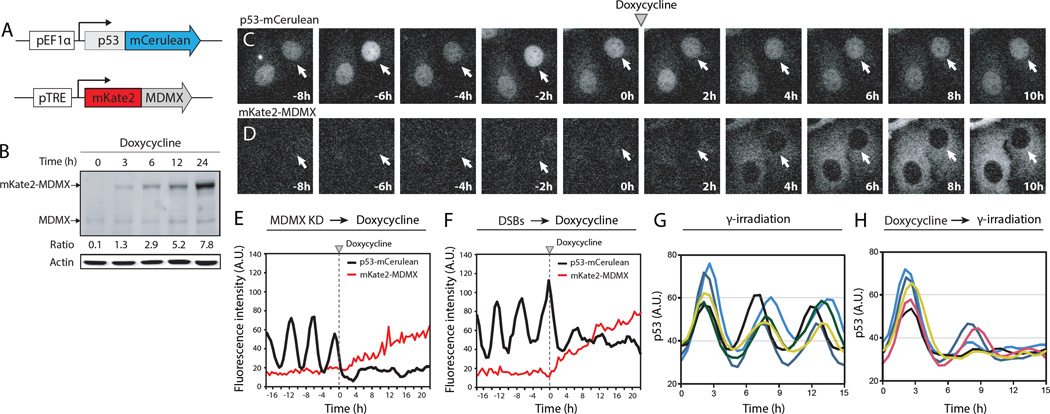
Figure 2. MDMX suppresses p53 oscillations in non-stressed conditions and after DNA damage.
(A) Schematic of the p53 and MDMX reporter constructs.
(B) Abundance of mKate2-MDMX in p53-MDMX reporter cells treated with doxycycline analyzed by western blot.
(C and D) Time-lapse microscopy images of p53-mCerulean (C) and mKate2-MDMX (D) after MDMX siRNAs (30hr), followed by doxycycline.
(E and F) Trajectories of p53-mCerulean and mKate2-MDMX levels are shown for cells with either MDMX knockdown (E) or NCS (F) treatment 30 hr prior to doxycycline addition.
(G and H) Trajectories of p53-mCerulean levels are shown for cells treated with NCS alone (G) or with prior treatment of doxycycline (H).

