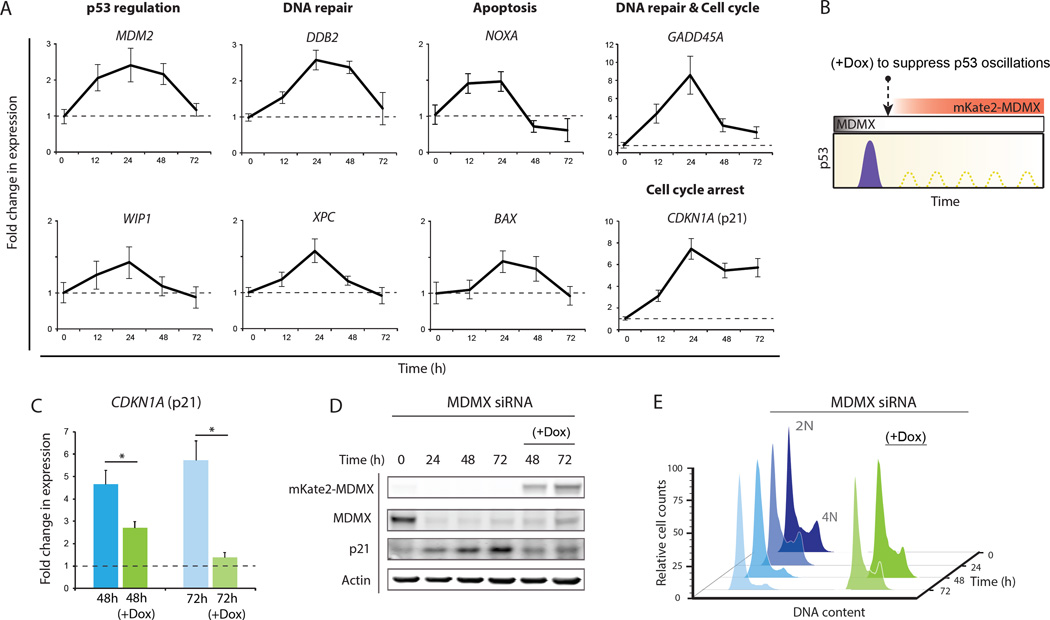
Figure 3. p53 oscillations during phase II are required to maintain p21 accumulation and cell cycle arrest.
(A) Expression of p53 target genes measured by qPCR after MDMX knockdown. Genes are grouped according to their function (n = 3; error bars represent SD).
(B) Schematic of suppressing p53 oscillations by inducing mKate2-MDMX using doxycycline. Doxycycline was added 24 hr after MDMX siRNA transfection.
(C) Abundance of transcripts of CDKN1A (p21) two and three days after MDMX siRNA transfection alone or followed by doxycycline addition (n = 3; error bars indicate S.D., *P < 10−2; P-values obtained by Student's two-sample unequal variance t-Test, with a two-tailed distribution).
(D) Abundance of p21 protein in cells depleted of MDMX alone or with doxycycline addition.
(E) Cell cycle profile after MDMX depletion alone or with doxycycline addition.

