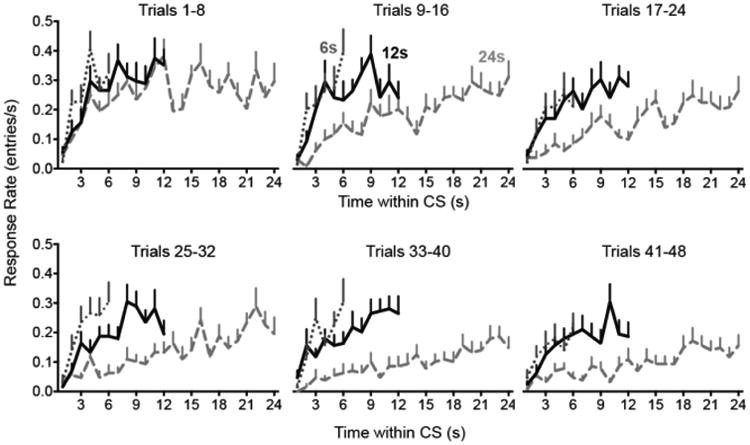
Figure 10.

Temporal distribution of responses during extinction in Experiment 2. The response rate is plotted as a function of time within the CS. All groups show an acceleration of responding in the early part of the CS. The location of the response rate asymptote appears to shift rightward over the course of extinction, particularly in Group 24.
