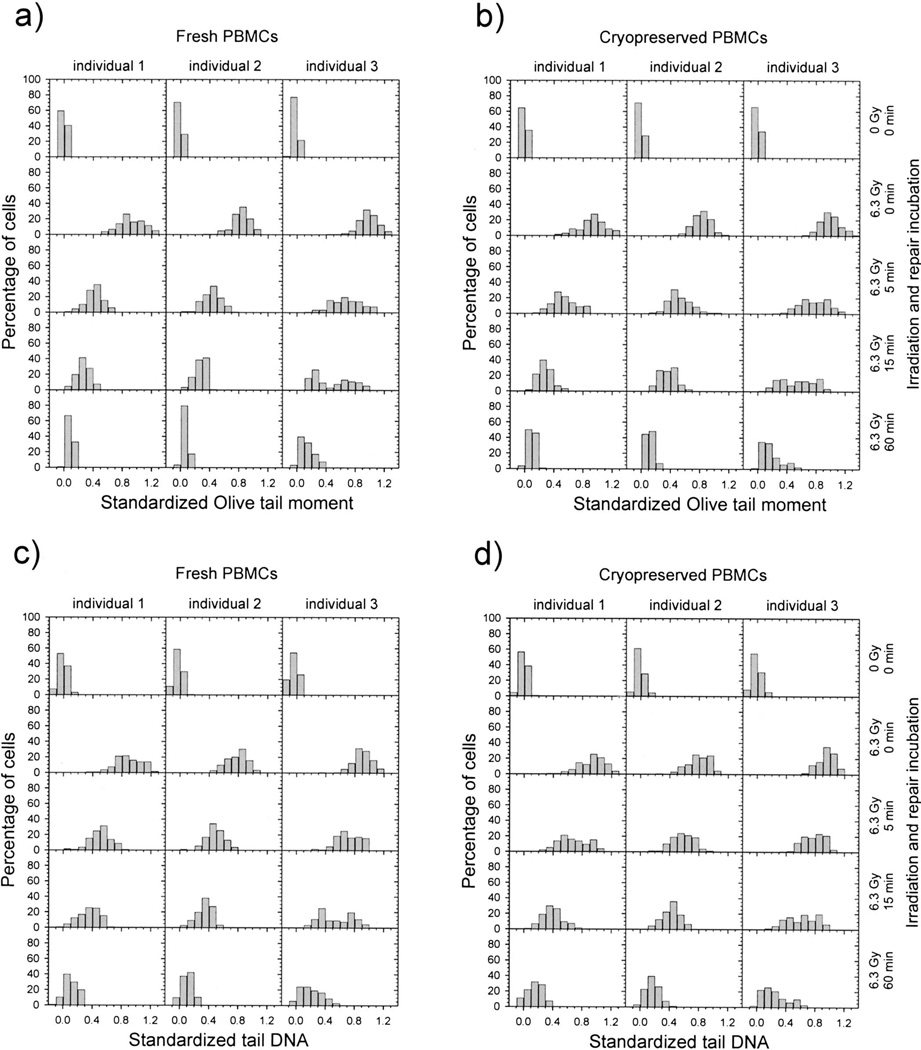
FIG. 6.
Histograms showing the distribution of standardized Olive tail moment (panels a, b) and standardized tail DNA (panels c, d) in fresh (panels a, c) and cryopreserved (panels b, d) PBMCs. PBMCs were untreated or were exposed to 6.3 Gy γ radiation and then incubated for 0–60 min. The PBMCs were obtained from the same individuals as in Fig. 5. A minimum of 138 cells representing three or four replicate samples were analyzed for each point.

