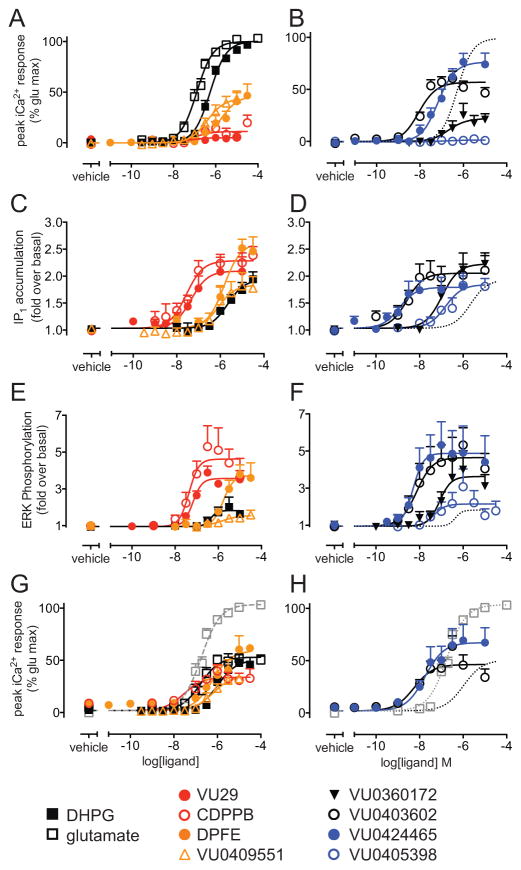
Figure 1. mGlu5 allosteric ligands have agonist activity for iCa2+ mobilization, IP1 accumulation and ERK phosphorylation in HEK293A-mGlu5-low.
Concentration-response curves for indicated mGlu5 orthosteric and allosteric ligands for iCa2+ mobilization (A & B), IP1 accumulation (C & D), ERK1/2 phosphorylation (E & F) and iCa2+ mobilization in the absence of 1.2mM CaCl2 (G & H; % glu max represents maximal glutamate response in the presence of 1.2mM CaCl2, curve from panel A shown in grey). In panels B, D, F and H, the DHPG curve is plotted as dotted lines for ease of reference. Responses were normalized to either the glutamate maximal response (iCa2+ mobilization) or represented as fold over basal (IP1 accumulation and ERK phosphorylation). IP1 and ERK1/2 phosphorylation experiments were performed in the presence of 10 U/mL GPT to minimize contribution of ambient glutamate. Data are expressed as mean + SEM of 3–17 experiments performed in duplicate, error bars not shown lie within the dimensions of the symbols.

