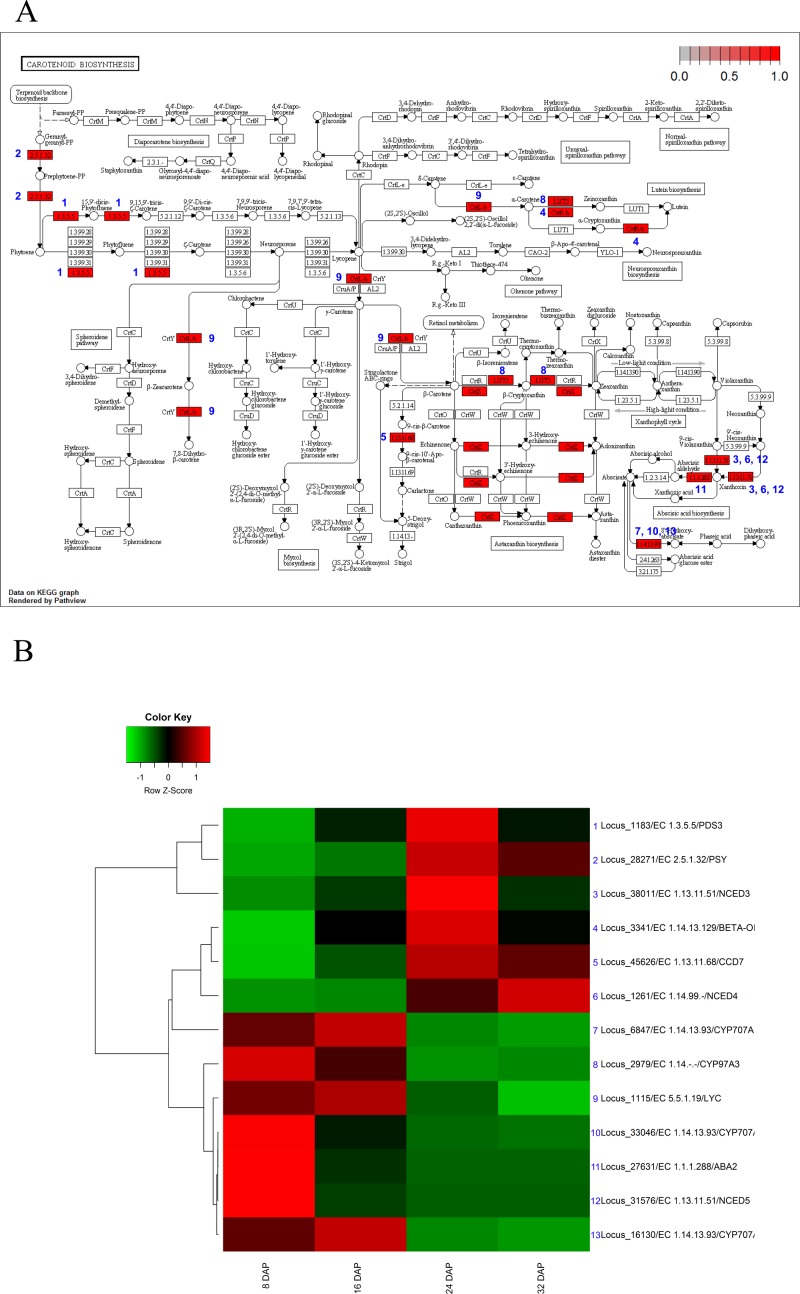
Figure 5. Pathway and differential expression analysis of carotenoid-biosynthesis pathway.
(A) Carotenoid-biosynthesis diagram from the KEGG Pathway analysis. Color-coded enzymes indicate target genes with differential expression. The numbers depicted in color-coded enzymes indicate genes in heat map. (B) Differentially expressed genes (DEGs) from the carotenoid-biosynthesis pathway diagram. The locus tag and enzyme code shown in carotenoid biosynthesis are described in a heat map.

