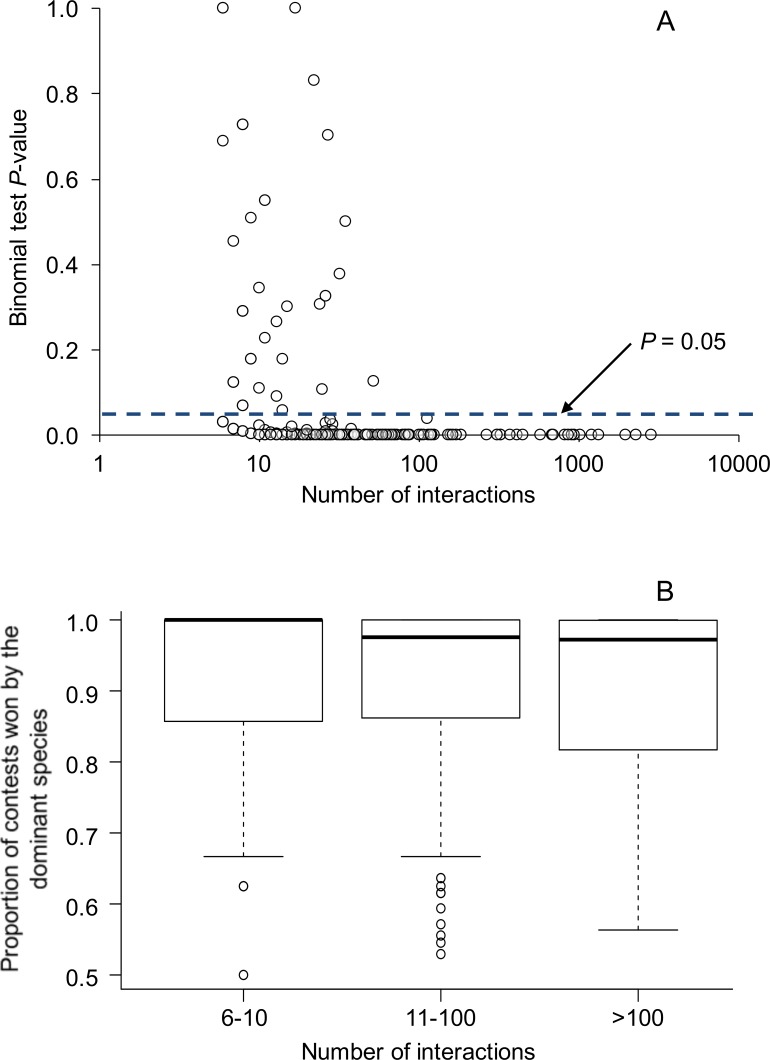
Figure 1. Relationship between the number of aggressive interactions observed between each species pair and (A) binomial test P-values testing for asymmetries in the outcomes of aggressive interactions, and (B) the proportion of aggressive contests won by the dominant species.
In (A), the dashed line illustrates the common P-value cutoff for statistical significance at 0.05. All species pairs with greater than 52 interactions showed statistically significant asymmetries; overall, 83% of species pairs showed statistically significant asymmetries. In (B), box plots show the median as a center line, the interquartile range as a box, values within 1.5*interquartile range as whiskers, and all data that lie outside the whiskers as circles. Overall, 84 species pairs had sample sizes between 6–10 interactions, 151 species pairs had 11–100 interactions, and 35 species pairs had >100 interactions.

