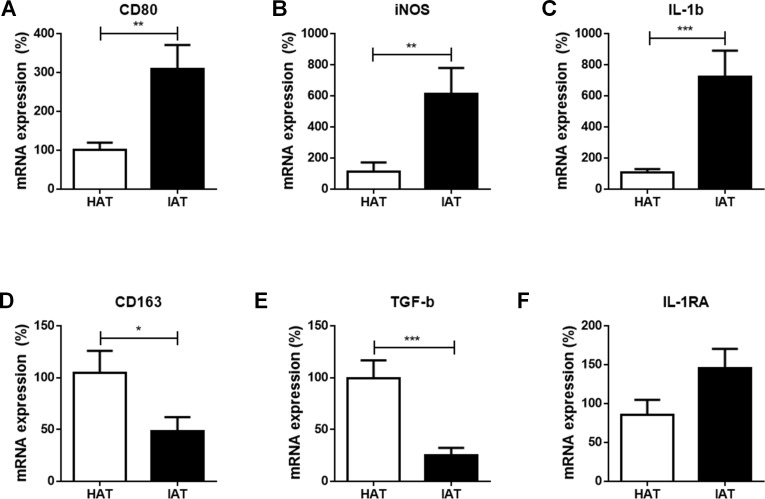
Figure 2. Messenger RNA expression levels of M1- and M2 markers in native HAT and IAT.
Messenger RNA was extracted from healthy adipose tissue (HAT, n = 20) and inflammatory adipose tissue (IAT, n = 20) samples adjacent to acute wound healing disorders . Expression of common pro-inflammatory M1 and anti-inflammatory M2 macrophage markers were measured by qRT-PCR. Relative mRNA expression levels are illustrated with mRNA expression of HAT set as 100%. (A–C) mRNA expression of M1 markers CD80, iNOS, and IL-1β; (D–F) mRNA expression of M2 markers CD163, TGF-β, and IL-1RA. Data are presented as mean mRNA expression ± SEM. Statistically significant differences are indicated by asterisks (∗, p < 0.05; ∗∗, p < 0.01; ∗∗∗, p < 0.001).

