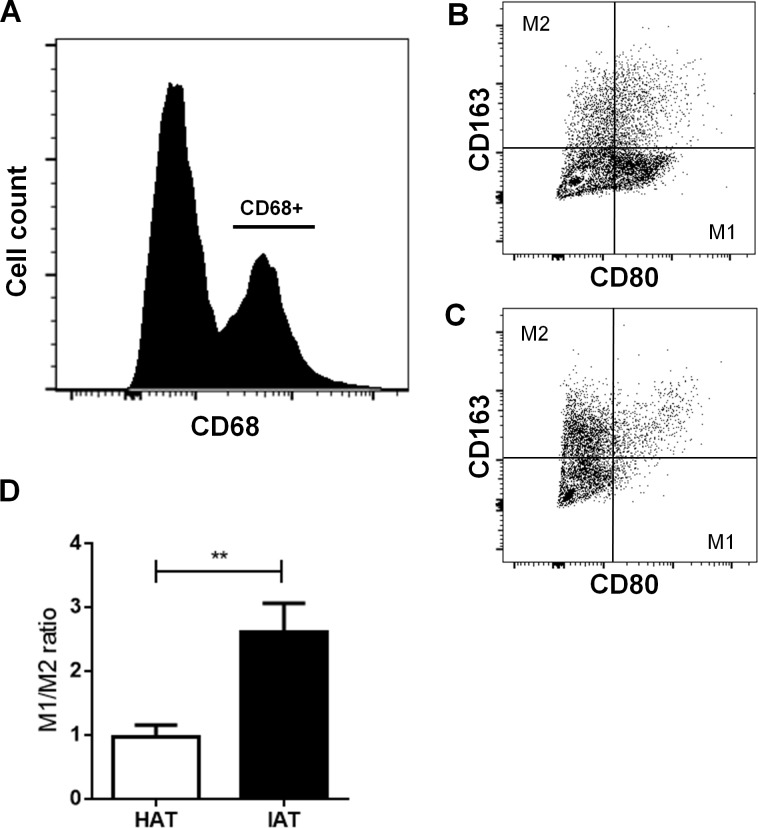
Figure 3. Surface expression of CD80 and CD163 in native HAT and IAT.
Stromal vascular fraction (SVF) cells were collected by collagenase digestion of healthy adipose tissue (HAT, n = 20) and inflammatory adipose tissue (IAT, n = 20) samples and subjected to flow cytometry analysis. (A) ATM were gated by selecting cells which were positive for the pan-macrophage marker CD68. (B) ATMs in IAT show high expression of the M1 macrophage marker CD80 and low expression of the M2 macrophage marker CD163. (C) ATMs in HAT show high expression of CD163 but low expression of CD80. (D) The M1/M2 ratio was calculated as the ratio between CD80+ and CD163+ cells and show an increased M1/M2 ratio in IAT. Data are presented as mean mRNA expression ± SEM. Statistically significant differences are indicated by asterisks (∗∗, p < 0.01).

