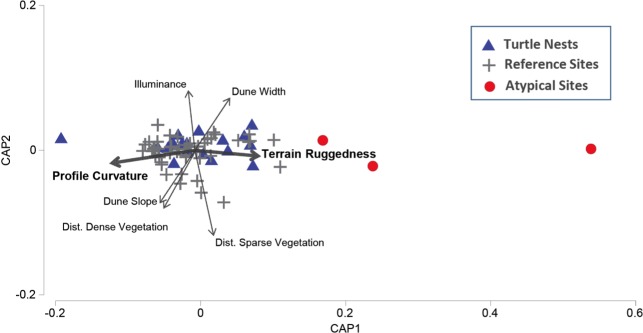
Figure 3. Canonical Analysis of Principle Coordinates (CAP) ordination.
Illustrating patterns of similarity in the environmental features of nest sites (green circles), reference sites with similar environmental traits (grey crosses), and those characterized by environmental features that were ‘atypical’ of nest sites (P < 0.001) (red stars). Vector width is scaled to the level of correlation (Pearson) with the primary CAP axis.

