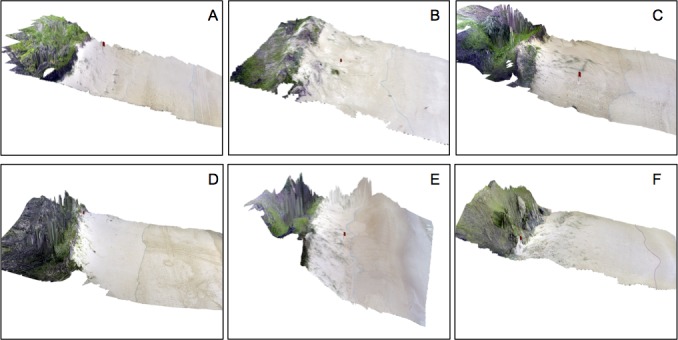
Figure 4. 3D perspective of typical and atypical nesting beaches.

Typical (A–C) and atypical (D–F) nesting beaches based on CAP analysis with overlaid site locations (red flag) and digitised waterline (blue). Horizontal scale varies with perspective and vertical exaggeration is 1.5×.
