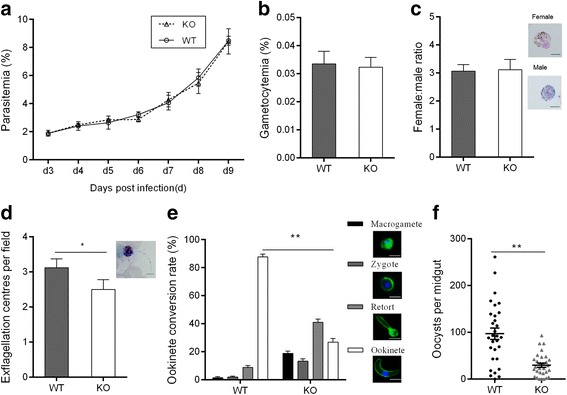
Fig. 5.

a Average parasitemia was calculated in mice after infection with the wild-type (WT) or Δpsop25 parasites (n = 5). b Gametocytemia in mice infected with WT or Δpsop25 parasites (n = 3). c Female: male gametocyte ratios of WT or Δpsop25 parasites (n = 3). d Exflagellation of WT and Δpsop25 microgametes (n = 3), *P < 0.05 (Student’s t-test). e Ookinete conversion rates in vitro of WT and Δpsop25 parasites. For c, d and e, characteristic morphologies of parasites are shown on the right (n = 3), **P < 0.01 (Student’s t-test). f Oocyst number per midgut in mosquitoes 10 days after feeding on mice infected with the WT and the Δpsop25 parasites. The horizontal bar shows the mean number of oocysts per midgut in mosquito (± SEM). **P < 0.01 (Mann-Whitney U-test). For a-f, all the data are representative of three separate experiments. Scale-bars: 5 μm
