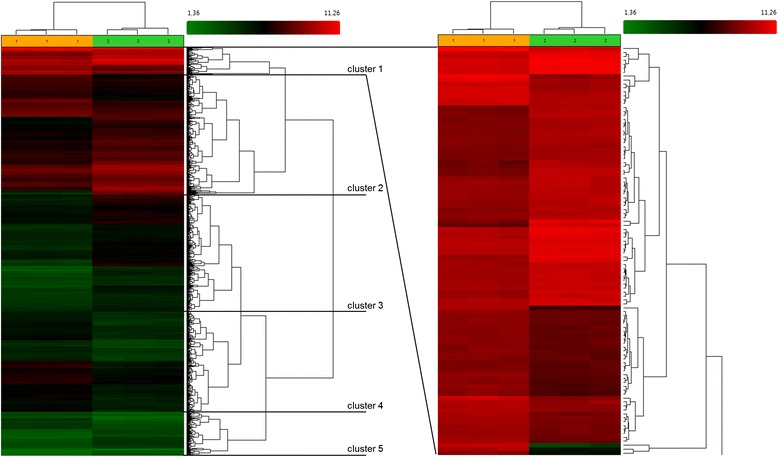
Fig. 4.

Hierarchical clustering and heatmap of regulated genes in high versus normal density GC culture. The different culture conditions are shown as orange and green above the heatmap reflecting the normal density culture and high density culture samples, respectively. The heatmap visualizes the signal for every gene in all 3 samples of each culture condition from lower hybridization signals (green) to higher signals (red)
