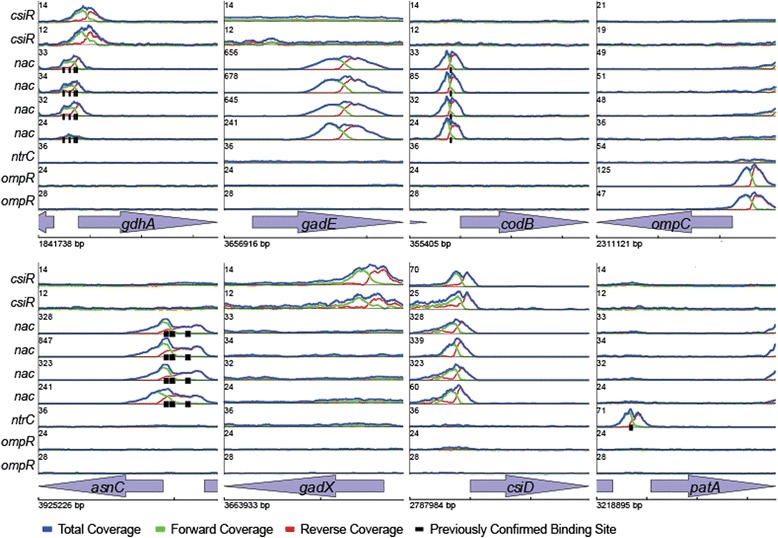
Fig. 1.

Mapping E. coli transcriptional regulatory interactions using ChIP-Seq. Examples of identified binding sites for csiR, nac, ntrC, and ompR. Each panel plots the total read coverage (blue), forward read coverage (green), and reverse read coverage (red). The maximum coverage for each plot is given by the number on the y-axis in units of coverage normalized to mean coverage. Multiple biological replicate experiments are shown for 3 TFs as noted on leftmost y-axes. ChIP-Seq coverage plots are shown for 8 separate genomic regions. The start location of each region is provided at the bottom left x-axes. The tick marks on the bottom x-axes are spaced 500 bp apart. Different regions are plotted at different scales for clarity. Previously described binding sites from EcoCyc are shown as black ticks below the coverage plot in each panel
