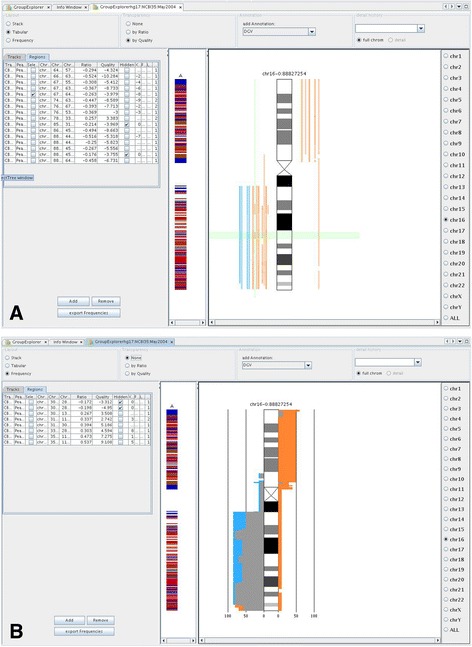
Fig. 5.

Absolute and relative frequencies of chromosomal aberrations depicted by means of the Group Explorer module. Comparison of chromosomal aberrations in two different types of breast cancer. a In the absolute view each aberration is given as vertical line to the left (deletions) and right (gains) of the chromosome ideogram in a tumor type specific colour. Ticking one box in the left table highlights the corresponding case in the absolute view and vice versa. b same cases in the relative view
