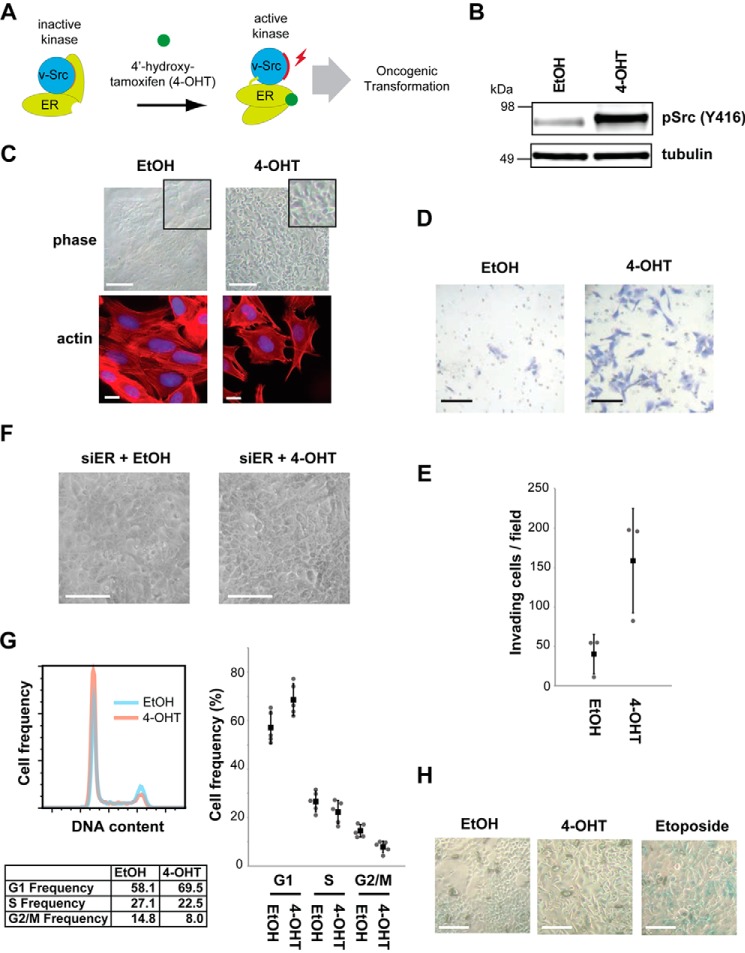
FIGURE 1.
MCF10A Src-ER, an oncogenic transformation model. A, schematic illustration of the MCF10A Src-ER model system for Src-mediated cellular transformation. B, total cell lysates from MCF10A Src-ER cells treated for 48 h with either EtOH or 1 μm 4-OHT, were immunoblotted with antibodies against pSrc (Tyr416) and α-tubulin. C, representative light microscopy images of MCF10A Src-ER cells treated for 48 h with either EtOH or 1 μm 4-OHT. Scale bar, 50 μm. Light microscopy images show representative fields of cells from each condition (top panels). MCF10A Src-ER cells treated for 48 h with either EtOH or 1 μm 4-OHT were stained with phalloidin and DAPI (bottom panels). Scale bar, 10 μm. D, Transwell invasion assay. Cells treated for 48 h with either EtOH or 1 μm 4-OHT were seeded into a Matrigel-coated Transwell invasion chamber and incubated overnight with chemoattractant in the bottom chamber. Invading cells were counted from 10 independent fields at 20× magnification. Scale bar, 50 μm. E, the individual values (gray circle), means (black box), and S.D. of means of invading cells from a field are shown. The means ± S.D. were derived from three biological replicates. F, representative light microscopy images of MCF10A Src-ER cells transfected for 72 h with siRNA against ER and treated for 48 h with either EtOH, or 1 μm 4-OHT. Scale bar, 50 μm. G, MCF10A Src-ER cells treated for 48 h with either EtOH or 1 μm 4-OHT were stained with PI and analyzed by flow cytometry. The individual values (gray circle), means (black box), and S.D. of means of cell frequencies from cell cycle phases are shown. The means ± S.D. were derived from five biological replicates. H, representative light microscopy images of MCF10A Src-ER cells treated for 48 h with either EtOH or 1 μm 4-OHT or for 1 h with 20 μm etoposide and stained using a senescence β-galactosidase staining kit. Scale bar, 50 μm.

