FIGURE 2.
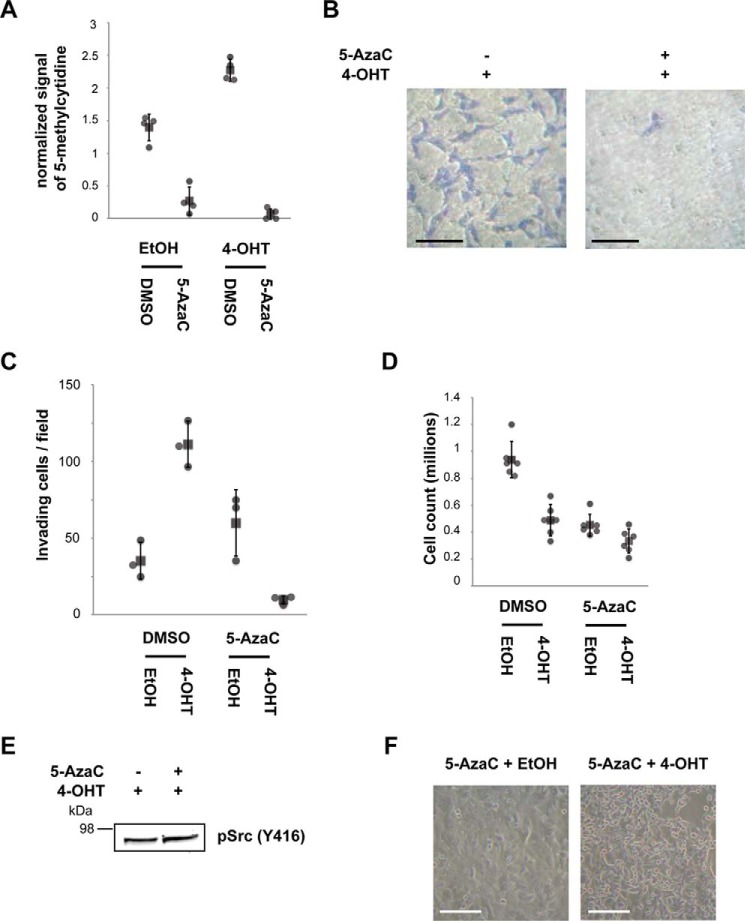
Inhibiting DNA methylation prevents cell invasiveness. A, cells were treated with the indicated combinations of EtOH, 1 μm 4-OHT, and 0.3 μm 5-AzaC. The quantified signals from the DNA dot blot using an anti-methylcytidine antibody shows the total DNA methylation levels of genomic DNA extracted from each condition. The individual values (gray circle), means (black box), and S.D. of means of 5-methylcytidine signals are shown. The means ± S.D. were derived from four biological replicates. B, Transwell invasion assay. The cells were treated with the indicated combinations of EtOH, 1 μm 4-OHT, and 0.3 μm 5-AzaC; seeded into a Matrigel-coated Transwell invasion chamber; and incubated overnight with chemoattractant in the bottom chamber. Invading cells were counted from 10 independent fields at 20× magnification. Scale bar, 50 μm. C, the individual values (gray circle), mean (black box), and S.D. of means of invading cells from a field are shown. The means ± S.D. were derived from three biological replicates. D, MCF10A Src-ER cells treated with a combination of vehicle controls, 1 μm 4-OHT, and 0.3 μm 5-AzaC were counted 96 h after plating. The individual values (gray circle), means (black box), and S.D. of means of cell counts are shown. The means ± S.D. were derived from six biological replicates. E, total cell lysates from MCF10A Src-ER cells treated with a combination of EtOH and 1 μm 4-OHT with 0.3 μm 5-AzaC were immunoblotted with the antibody against pSrc (Tyr416). F, representative light microscopy images of MCF10A Src-ER cells treated with a combination of EtOH and 1 μm 4-OHT with 0.3 μm 5-AzaC. Scale bar, 50 μm.

