FIGURE 3.
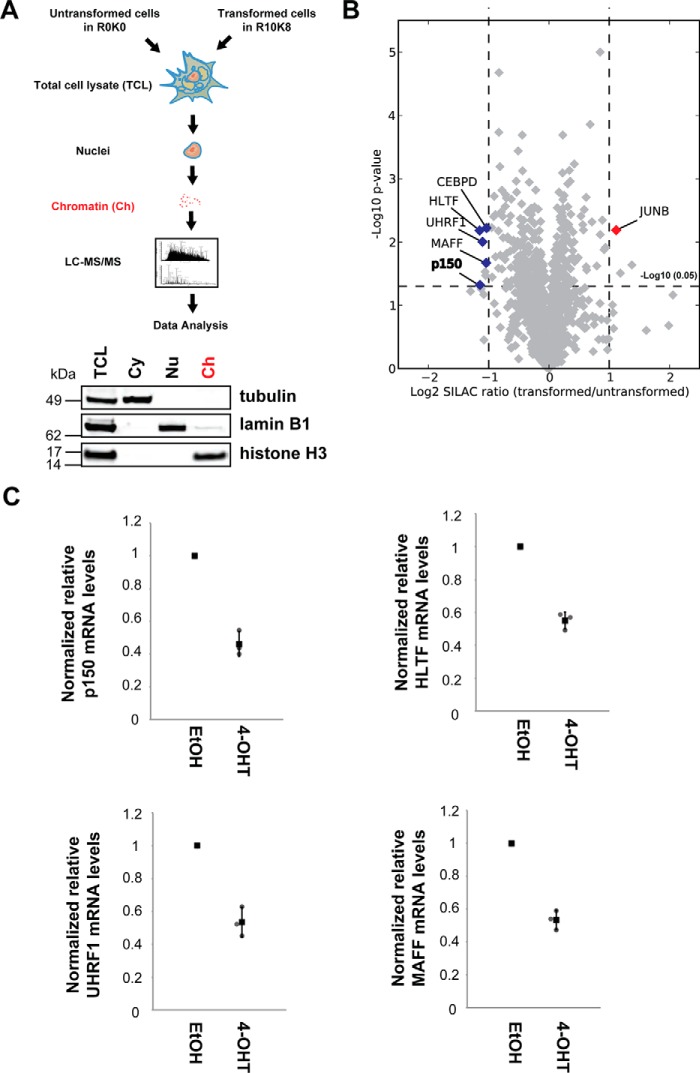
Quantitative proteomic screen for chromatin-associated regulators of cell motility and invasiveness. A, cells grown in either light (R0K0) or heavy (R10K8) SILAC medium were treated for 48 h with either EtOH or 1 μm 4-OHT, respectively. Equal numbers of MCF10A Src-ER cells from each condition were mixed, and the subcellular fractions were isolated. Total cell lysates (TCL) and cytoplasm (Cy), nucleoplasm (Nu), and chromatin (Ch) fractions were immunoblotted with antibodies against the marker proteins, α-tubulin (Cy), lamin B1 (Np), and histone H3 (Ch) (bottom panels). Proteins in the chromatin fractions were in-gel digested with trypsin, and tryptic peptides were analyzed by LC-MS/MS. B, the mean log2 SILAC ratio (transformed/untransformed) and −log10 p value of potential chromatin-associated proteins are indicated in the x and y axes, respectively. The mean values and p values were derived from three biological replicates. The scatter plot was visualized using Datashop. Chromatin-associated proteins significantly changed upon 4-OHT treatment are highlighted. C, total RNA from MCF10A Src-ER cells treated for 48 h with either EtOH or 1 μm 4-OHT were analyzed by qRT-PCR. Expression levels of p150, HLTF, UHRF1, and MAFF were normalized by GAPDH pre-mRNA level, and expression levels in cells treated with EtOH were set to 1. The individual values (gray circle), means (black box), and S.D. of means of relative mRNA levels are shown. The means ± S.D. were derived from three biological replicates.

