FIGURE 5.
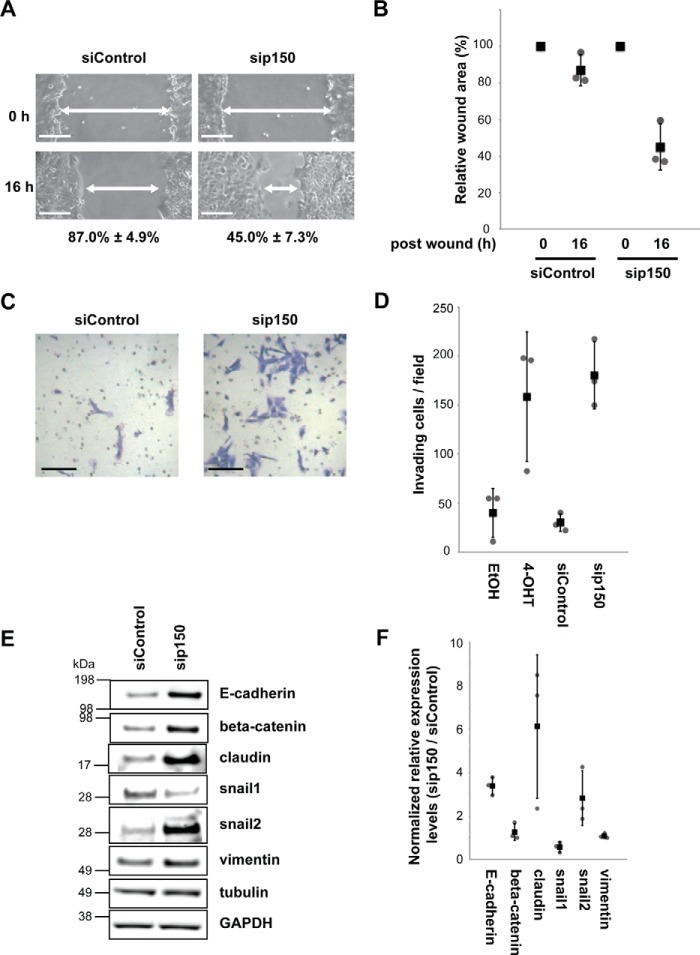
CAF1 is a regulator of cell motility and invasiveness. A and B, MCF10A Src-ER cells transfected for 72 h with either control siRNA or siRNA against p150 were wounded. Representative light microscopy images of wound areas are shown at 0 and 16 h after wounding. Scale bar, 100 μm. The wound areas from five independent fields were automatically measured using TScratch software. The calculated wound sizes of each field at 0 h were set to 100%. The individual values (gray circle), means (black box), and S.D. of means of relative wound areas are shown. The means ± S.D. were derived from three biological replicates. C and D, equal numbers of MCF10A Src-ER cells treated for 48 h with either EtOH or 1 μm 4-OHT or transfected for 72 h with either control siRNA or siRNA against p150 were spread onto Matrigel-coated invasion chambers. Representative light microscopy images show positively invading cells. Invading cells were counted as above. The individual values (gray circle), means (black box), and S.D. of means of invading cells from a field are shown. The means ± S.D. were derived from three biological replicates. E, total cell lysates from MCF10A Src-ER cells treated with control siRNA and p150 siRNA were immunoblotted with antibodies against E-cadherin, β-catenin, claudin, snail1, snail2, vimentin, α-tubulin, and GAPDH. F, dot blot showing the quantification of the immunoblot signals in E and replicate analyses. The individual values (gray circle), means (black box), and S.D. of means (error bars) of immunoblot signals were derived from three biological replicates.

