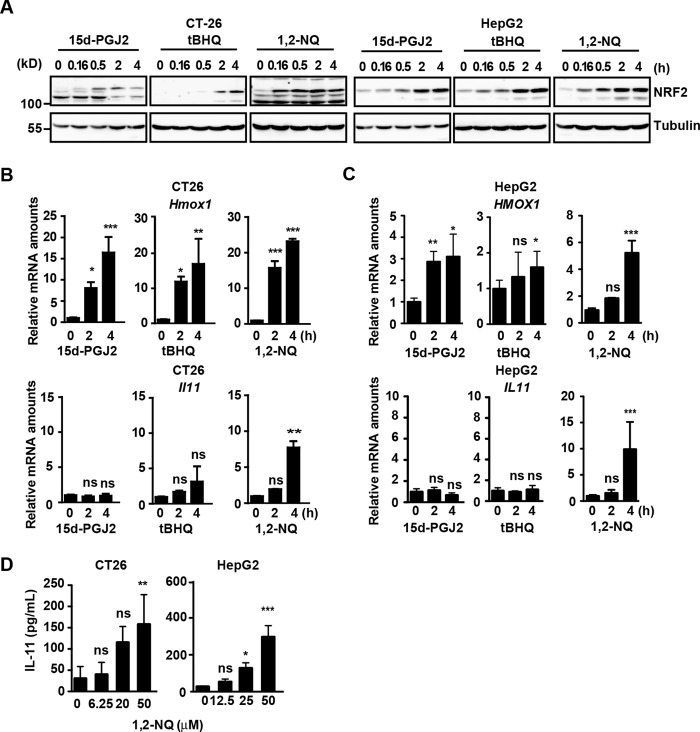
FIGURE 1.
IL-11 is induced by 1,2-NQ. A–C, CT26 and HepG2 cells were stimulated with 15d-PGJ2 (10 μm), tBHQ (100 μm), or 1,2-NQ (50 μm) for the indicated times. A, cell lysates were analyzed by immunoblotting with the indicated antibodies. B and C, RNAs were extracted from CT26 (B) or HepG2 (C) cells. Relative amounts of Hmox1 and Il11 mRNAs were determined by qPCR. Results are mean ± S.D. (error bars) of triplicate samples. D, CT26 and HepG2 cells were stimulated with the indicated concentrations of 1,2-NQ (μm) for 18 h. Concentrations of IL-11 in the culture supernatants were determined by ELISA. Results are mean ± S.D. of triplicate samples. *, p < 0.05; **, p < 0.01; ***, p < 0.001; ns, not significant versus untreated cells. All results are representative of two or three independent experiments.

