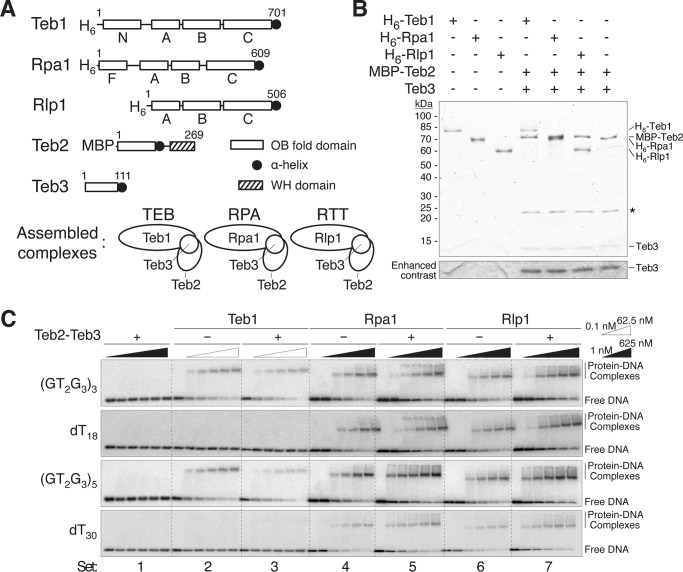
FIGURE 3.
Comparison of DNA binding by Teb1, TEB, Rpa1, RPA, Rlp1, and RTT. A, domain structures for Teb1, Rpa1, Rlp1, Teb2, and Teb3 and complexes formed by co-assembly that were assayed for DNA binding affinity. B, colloidal Coomassie staining after SDS-PAGE of proteins and complexes used for DNA binding assays. *, a background protein in the Teb2-Teb3 purification. Enhanced contrast for the bottom of the gel is shown below the main gel panel. C, DNA binding by Teb2-Teb3, Teb1, TEB, Rpa1, RPA, Rlp1, and RTT. A fixed concentration of the indicated end-labeled ssDNA oligonucleotide (∼10 pm) was incubated with protein or protein complex added at steps of final concentration over the indicated range of 0.1–62.5 or 1–625 nm.

