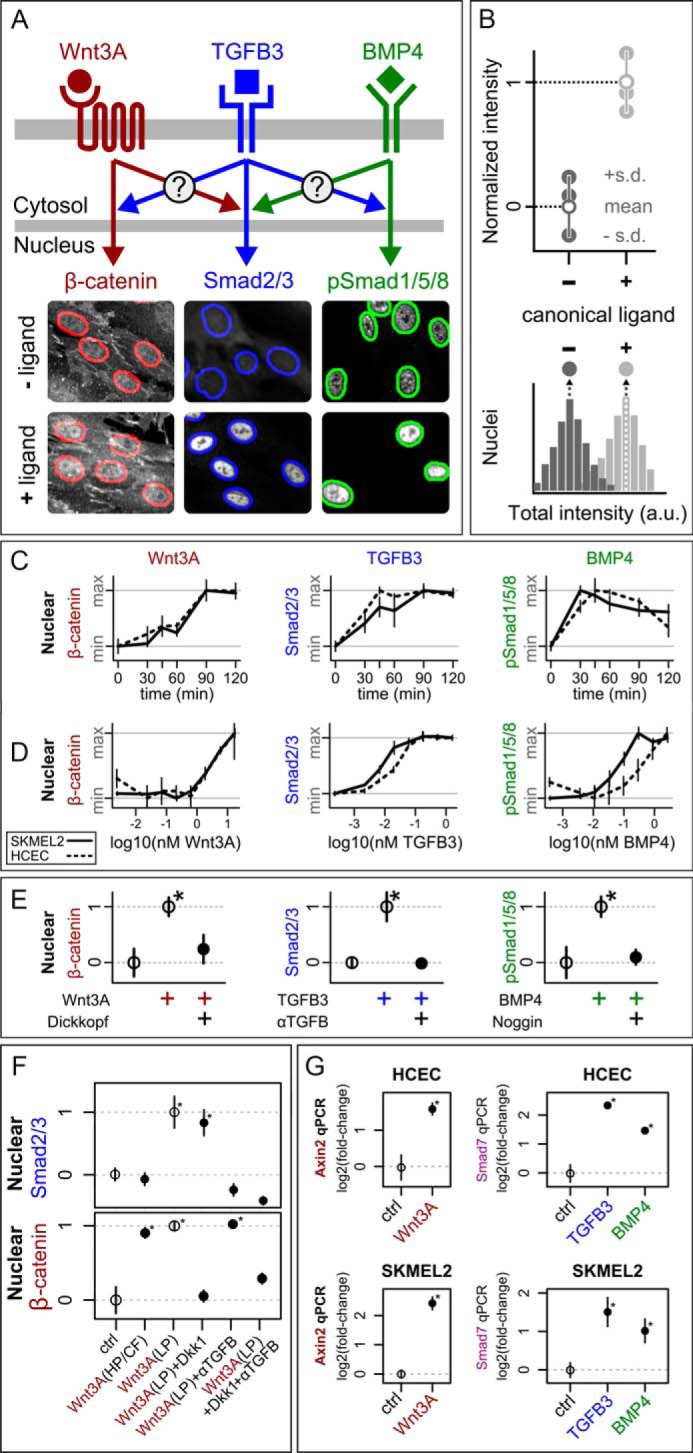
FIGURE 1.

Establishment of our system for investigating crosstalk. A, overview of experimental approach. Cells were treated with combinations of purified ligands, and nuclear transcription factor responses were measured by single-cell immunofluorescence imaging. Sample images of HCECs after 2 h with or without ligand show that Wnt3A globally increases β-catenin levels, TGFβ3 causes bulk nuclear translocation of Smad2/3, and BMP4 increases nuclear phospho-Smad1/5/8. Nuclei are outlined using the same segmentation approach as in all experiments (see “Experimental Procedures”). B, graphic of image-based nuclear transcription factor quantification. Total nuclear intensity was measured for each cell (see “Experimental Procedures”), and the population medians of these values (filled circles) from each distribution (bottom) were obtained for each of three replicate experiments. The means and standard deviations (S.D.) of these median values were then normalized so that the control mean was 0 and the canonical ligand-only mean was 1 (top, open circles). C and D, time-course (C) and dose-response curves (D) at 1 h for SKMEL2 (solid lines) and HCEC (dashed lines) in response to Wnt3A (red), TGFβ3 (blue), or BMP4 (green). Values were measured as in B and normalized to have the same minimum (min) and maximum (max) values, n = 3 per time point. Concentrations were as follows: Wnt3A (4.8 nm), TGFβ3 (180 pm), and BMP4 (2.6 nm). E, the input/output relationships can be blocked by co-treatment with specific antagonists. Left, Dickkopf-1 (38 nm) blocks Wnt3A (4.8 nm) → β-catenin in SKMEL2s (2 h). Middle, a pan-TGFβ-blocking antibody (αTGFβ, 5 μg/ml) blocks TGFβ3 (450 pm) → Smad2/3 in HCECs (2 h). Right, Noggin (4.3 nm) blocks BMP4 (1.9 nm) → pSmad1/5/8 in SKMEL2s (1.5 h). F, low-purity Wnt3A (used only in this panel) causes dose-dependent accumulation of Smad2/3. The Wnt → Smad2/3 response is likely due to trace contamination by TGFβ ligands. This response is completely blocked by a pan-TGFβ-blocking antibody (αTGFβ, 5 μg/ml) but not blocked by Wnt antagonist (Dkk1, 38 nm) or observed for high-purity/carrier-free (HP/CF) Wnt ligands. Concentrations were as follows: Wnt3A (4.8 nm HP/CF, 4 nm low purity (LP)). ctrl, control. G, cells show transcriptional changes to canonical ligands after 2-h treatments. Concentrations were as follows: Wnt3A (4.8 nm), TGFβ3 (450 pm), and BMP4 (1.9 nm). Open circles show reference values used for scaling. n = 3 for all points, * indicates p value <0.05 compared with control (two-sided t test).
