FIGURE 2.

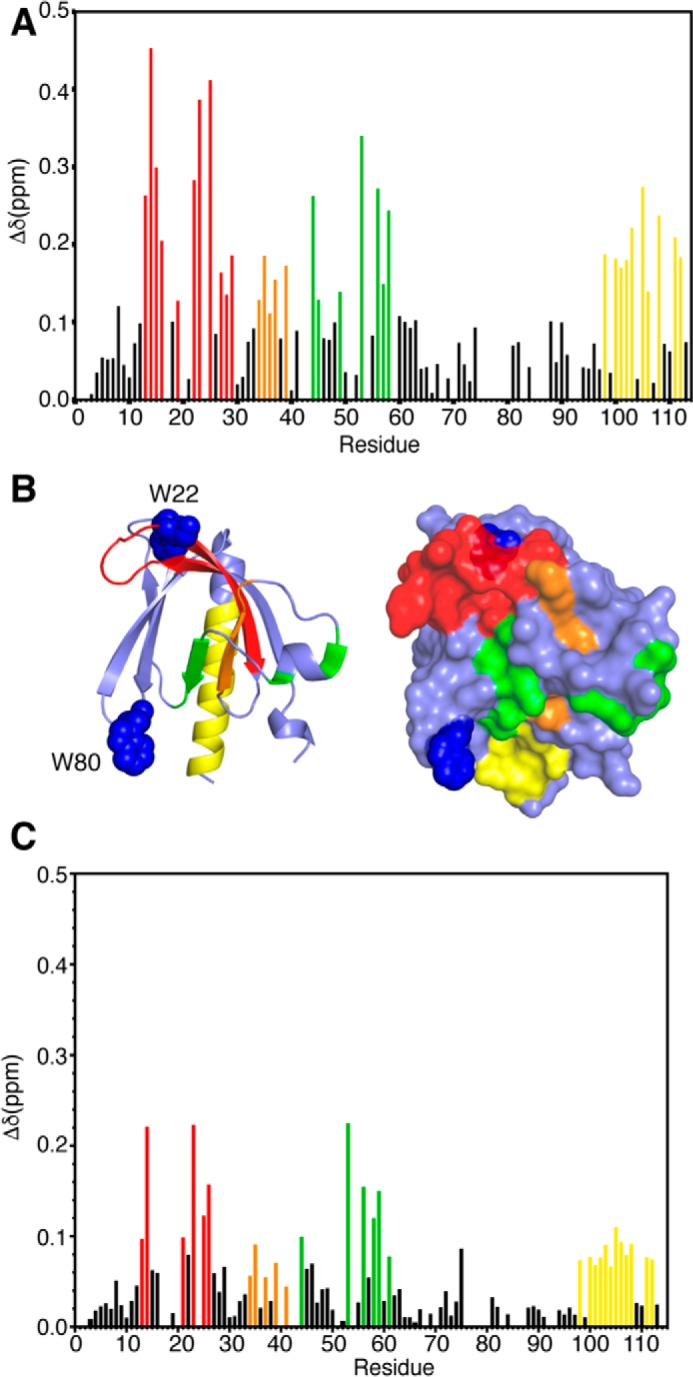
A, histogram of normalized 1H-15N chemical shift changes versus residue number calculated from the HSQC spectra for Akt(PHD) upon titration with diC4-PI(3,4,5)P3. B, Structure of the Akt(PHD) protein (Protein Data Bank code 1H10) highlighting residues that exhibited substantial (>0.1 ppm) chemical shift changes upon diC4-PI(3,4,5)P3 binding (red, residues 13–29; orange, residues 34–39; green, residues 49–58; yellow, 98–114). Tryptophan residues 22 and 80 are shown as blue spheres. C, histogram of normalized 1H-15N chemical shift changes versus residue number calculated from the HSQC spectra for Akt(PHD) upon titration with IP4.
