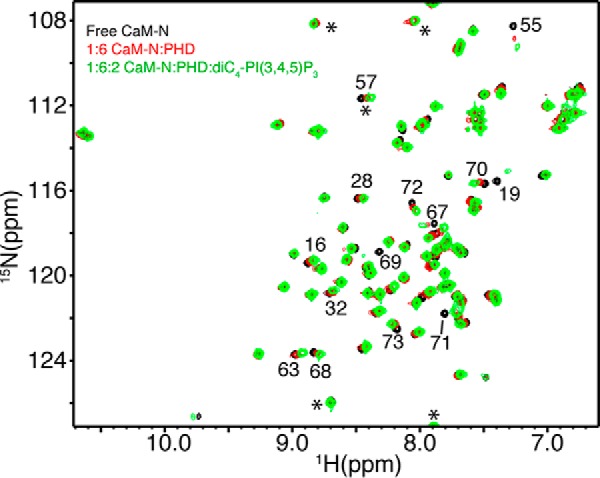
FIGURE 6.

Two-dimensional 1H-15N HSQC spectra obtained on a 15N-labeled CaM-N at 60 μm as titrated with Akt(PHD). Spectra in black and red were obtained for CaM-N in the free state and in complex with excess Akt(PHD) to ensure saturation (1:6 ratio). The spectrum in green was obtained for the CaM-N·Akt(PHD) complex after diC4-PI(3,4,5)P3 was added at 2:1. The 1H-15N signals of CaM-N do not revert back to the positions observed for free CaM-N, indicating that Akt(PHD) is still bound to CaM-N upon titration of diC4-PI(3,4,5)P3. Signals denoted by asterisks are folded in the spectrum by 20 ppm.
