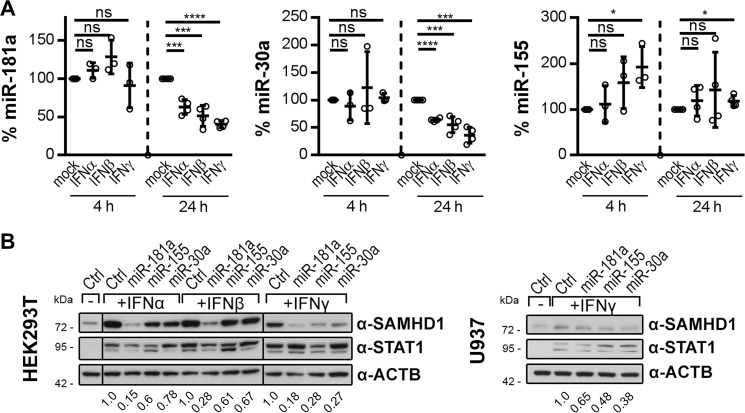
FIGURE 6.
miR-181a and miR-30a are down-regulated by IFNs in monocytes and prevent IFN-induced up-regulation of SAMHD1 protein. A, primary human monocytes were stimulated with 1000 units/ml IFNα, IFNβ, or IFNγ for 4 and 24 h, and levels of endogenous miR-181a (left), miR-30a (middle), miR-155 (right) and small nuclear RNA controls RNU6B or snRNAU6 were quantified. Data were corrected for RNU6B. miR-181a quantification of one donor was corrected for snRNAU6. For every individual donor, the -fold changes to the untreated samples of the respective time point were calculated based on the mean of two biological replicates per donor, each measured in three technical replicates. The means ± S.D. (error bars) of the -fold changes of three donors for the 4 h (n = 3) and four donors for the 24 h (n = 4) time points are depicted. B, mimics of miR-181a, miR-155, or miR-30a or negative control mimics (Ctrl) were delivered into HEK293T (left) and U937 cells (right). The cells were stimulated with 1000 units/ml IFNα, IFNβ, or IFNγ 3 h post-transfection or were left mock-treated. Cells were harvested 48 h post-transfection and analyzed by immunoblotting for protein levels of SAMHD1, STAT1 to monitor successful stimulation, and ACTB as loading control. The immunoblot signals were densitometrically quantified, and the ratios of SAMHD1/ACTB normalized to the respective ratio of transfected Ctrl mimics are displayed. Dividing lines indicate splicing of the original image. The presented immunoblots are representative of two independent experiments (n = 2). ns, p > 0.05; *, p ≤ 0.05; ***, p ≤ 0.001; ****, p ≤ 0.0001.

