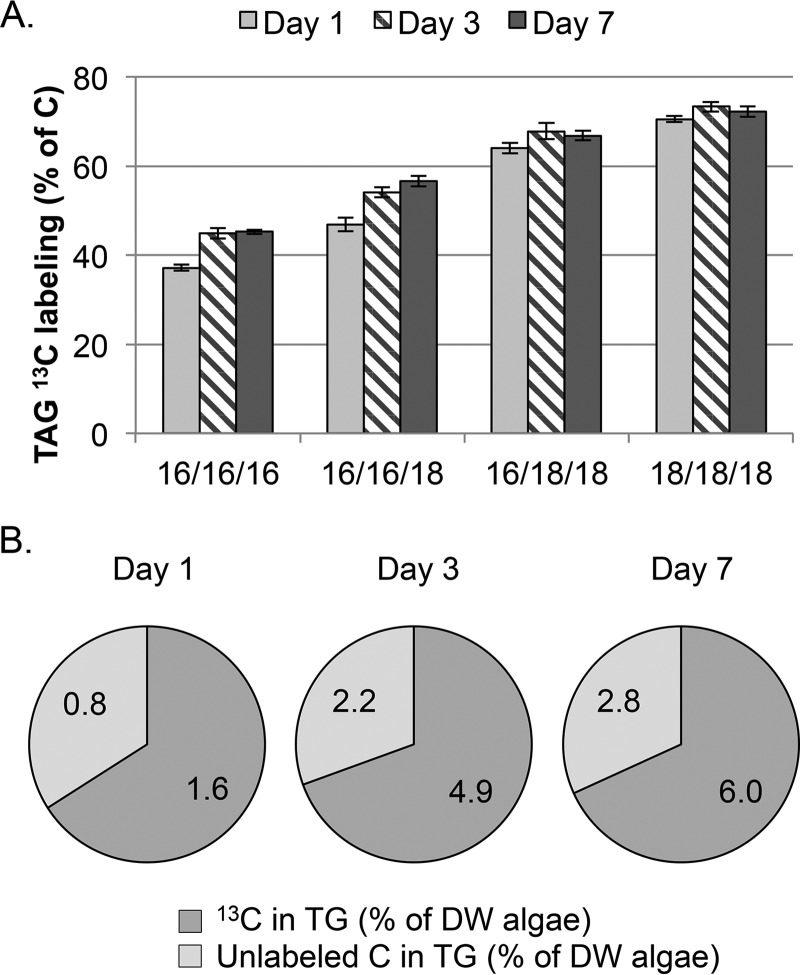
FIGURE 4.
13C labeling from 13CO2 of TG molecular species during a time course of nitrogen starvation. Labeled TG molecular species were separated chromatographically and isolated, and the 13C content was measured by LC-MS. Data are shown as 13C labeling in TG molecular species (A) and the relative amount of 13C and unlabeled 12C in the total TG pool (B). The numbers indicate the quantity of 13C (dark gray) and 12C (light gray) in the TG pool as a percentage of the total dry weight of algae. Error bars represent S.D.; n = 3.

