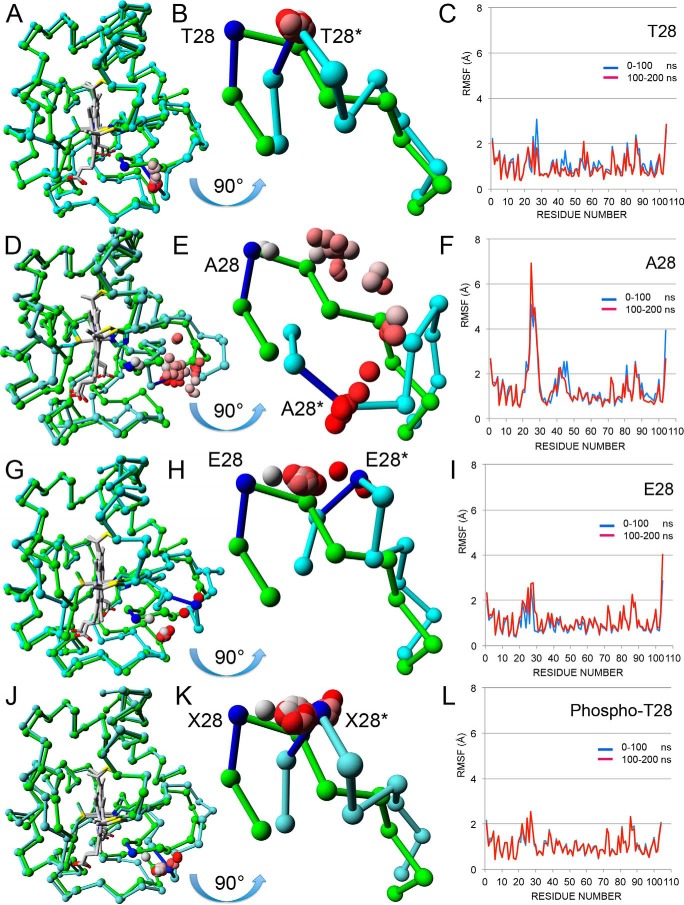
FIGURE 3.
Structural and molecular dynamics analyses. A, chain A from the WT crystal structure (PDB entry 5C0Z) before (green) and after (cyan) 200 ns of molecular dynamics are shown as Cα tracings superimposed using only main chain atoms. The hemes (Hec201) are shown in gray. The average Thr28 Cα positions for the 39 intermediate 5-ns steps between the two end points are shown as spheres colored in a gradient from gray (5 ns) to red (195 ns). B, the mobile loop (amino acids 22–30) from A is shown in greater detail after rotation by 90° about its horizontal axis to generate a “bottom-up” view. The Cα atoms for the starting (Thr28) and ending (Thr28*) structures are colored blue. The intermediate Cα atoms (gray to red) all cluster about Thr28*, showing that the loop jumps immediately to its minimum energy position and stays there. The distance between Thr28 Cα and Thr28* Cα is 4.5 Å. C, the RMSF for the first 100 ns (blue line) and the second 100 ns (red line) by residue are plotted together. Two RMSF values (Lys27 and Ala44) are noticeably lower in the second 100 ns. D, chain A from the T28A crystal structure (PDB entry 5C9M) before (green) and after (cyan) 200 ns of molecular dynamics. See A for details. E, equivalent to B, except the two loops are from D. Over the 200 ns, the Cα atom of Ala28 pauses at four distinct intermediate positions before clustering around the final position. The distance between Ala28 Cα and Ala28* Cα is 11.9 Å. F, equivalent to C for T28A Cytc. The RMSF values for Ala44 are lower in the second 100 ns, but those for Lys27 are significantly higher in the second 100 ns, in fact the highest seen in all four RMSF plots. G, chain A from the T28E crystal structure (PDB entry 5DF5) before (green) and after (cyan) 200 ns of molecular dynamics. See A for details. H, equivalent to B, except the two loops are from G. Over the 200 ns, the Cα atom of Glu28 clusters at a midway position before moving to its final position near the end of the simulation. The distance between Glu28 Cα and Glu28* Cα is 7.2 Å. I, equivalent to C for T28E Cytc. The RMSF values for Ala44 are of average size and similar for both halves of the simulation. The RMSF values for the loop containing Glu28 are higher than average but similar for both halves of the simulation. J, the Cα tracings of chain A from the WT crystal structure (PDB entry 5C0Z) with a phosphate group modeled onto Thr28 are shown superposed before (green) and after (cyan) 200 ns of molecular dynamics. See A for details. K, equivalent to B, except the two loops are from J. Over the 200-ns period, the Cα atom of Thr(P)28 moves quickly to the final position and clusters around it. The distance between Xaa28 (X28) Cα and Xaa28* Cα is 5.2 Å. L, equivalent to C for the Tpo28 model. The RMSF values for the loop containing Glu28 are higher than average but similar for both halves of the simulation.

