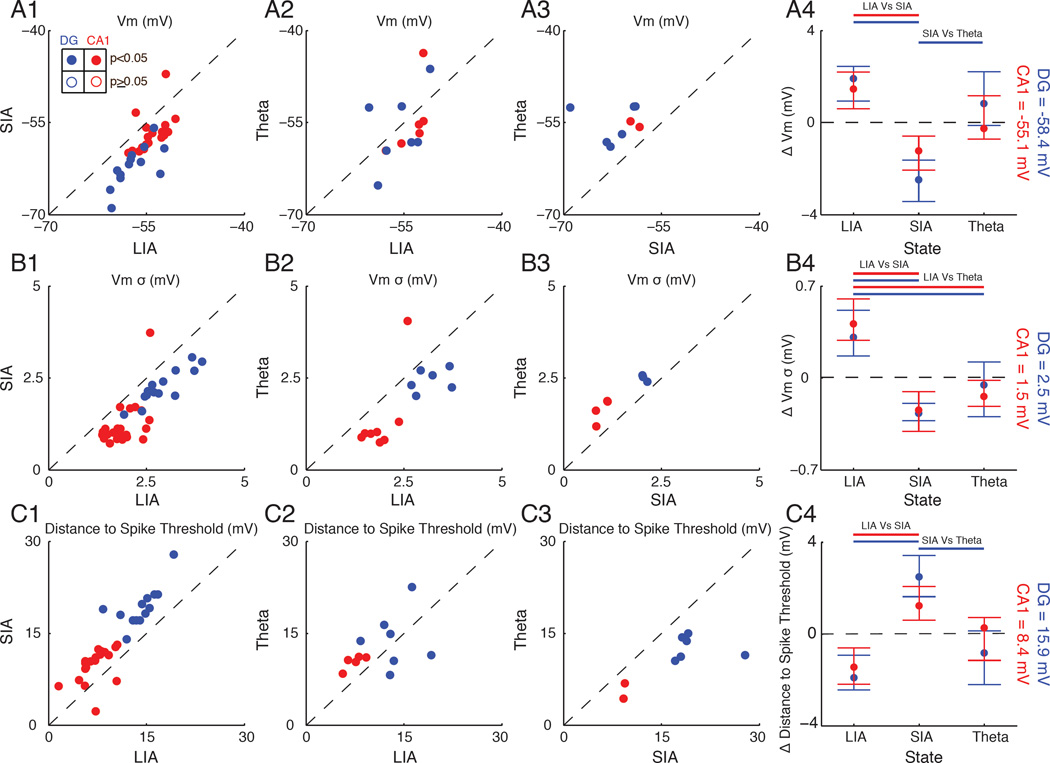
Figure 4. Membrane potential mean, variability, and distance to threshold are state-dependent.
(A1) Scatter plot showing the average Vm during LIA compared to SIA. Each point is the average from a single neuron. Dentate granule cells are colored in blue, with filled circles marking neurons with significant changes in Vm. CA1 pyramidal neuron averages are marked in red.
(A2) Same as in A1, but comparing LIA and Theta.
(A3) Same as in A1, but comparing SIA and Theta.
(A4) Circles mark each state’s Vm (median across neurons) after subtracting the mean Vm across states (the dotted line marking zero; absolute value reported on right) for dentate granule cells (blue) and CA1 pyramidal neurons (red). The whiskers mark the 25th and 75th percentiles. Bars above indicate significant differences (p<0.05) using a Mann-Whitney U test.
(B) Same as in (A), but for Vm variability.
(C) Same as in (A), but for distance to spike threshold. The distance to spike threshold was computed as the average spike threshold across LIA, SIA, and Theta epochs minus the membrane potential from each state.

