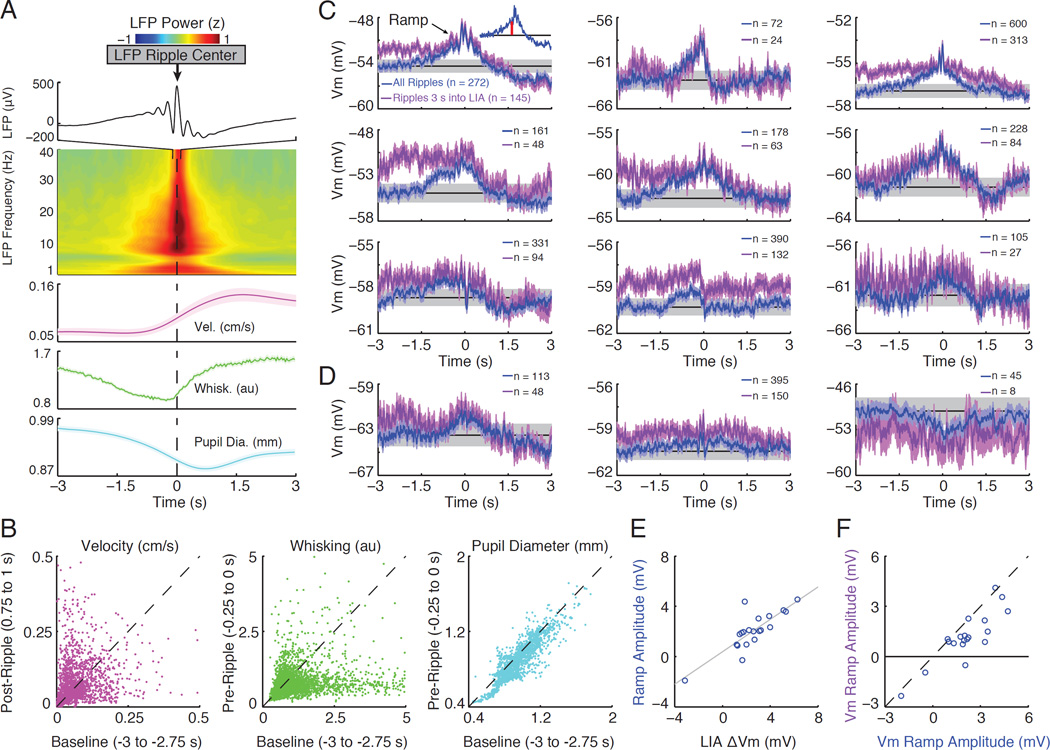
Figure 5. Transitions to LIA contribute to pre-ripple ramps in the membrane potential.
(A) The top panel displays the average ripple-triggered LFP from −100 to 100 ms showing the average ripple in the CA1 cell layer. The middle panel shows the average LFP power (z-score by frequency) from −3 to 3 s triggered on ripples, which occur at time 0. The bottom panels show the average velocity, whisking, and pupil diameter around ripple onset (shaded regions mark mean ± SEM).
(B) Scatter plots of median velocity before (Baseline) compared after ripples (Post- Ripple), and whisking and pupil diameter well before (Baseline) compared to just before (Pre-Ripple) ripples. Each point comes from a single ripple and the axes labels list the time windows used for computing median values. Ripples were preceded by a significant decline in whisking activity (n=3705 ripples) and pupil diameter (n=1835 ripples; p<0.001, Wilcoxon signed-rank tests).
(C) Ripple-triggered averages of the subthreshold Vm for individual dentate granule cells that show significant pre-ripple ramps (blue). The average Vm using only ripples occurring 3 seconds into an LIA epoch are shown in purple. Blue and purple shaded regions mark the 95% confidence intervals for each sample. The grey band marks the mean confidence intervals of the pre-ripple Vm (from −3 to −2 s) using all ripples (from the blue trace). The average Vm from this same interval is marked by the black line. The number of ripples entering each average is reported in the legends. The inset illustrates how ramp amplitude (red bar) was computed.
(D) Same as in (C), but for three neurons showing smaller ramps that were not statistically significant.
(E) Scatter plot of the amount each granule cell depolarizes during transitions to LIA (x741 axis) versus the amplitude of its ramp (y-axis).
(F) Scatter plot showing the amplitude of the ramps using all ripples (x-axis) compared to using only ripples occurring greater than 3 seconds into an LIA epoch (y-axis).
See also Figure S3.

