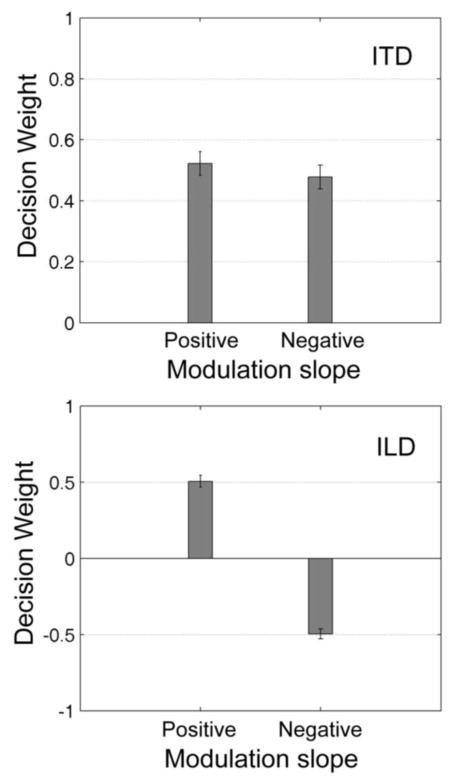
Figure 5.
Results from experiment 2 averaged across three observers. Top panel plots estimated decision weights associated with ITDs in the positive and negative modulation slopes (τ in Panel A of Fig. 1). Bottom panel shows decision weights associated with ILDs in the positive and negative modulation slopes (λ in Fig. 1). Error bars show +/− 1 standard deviation.

