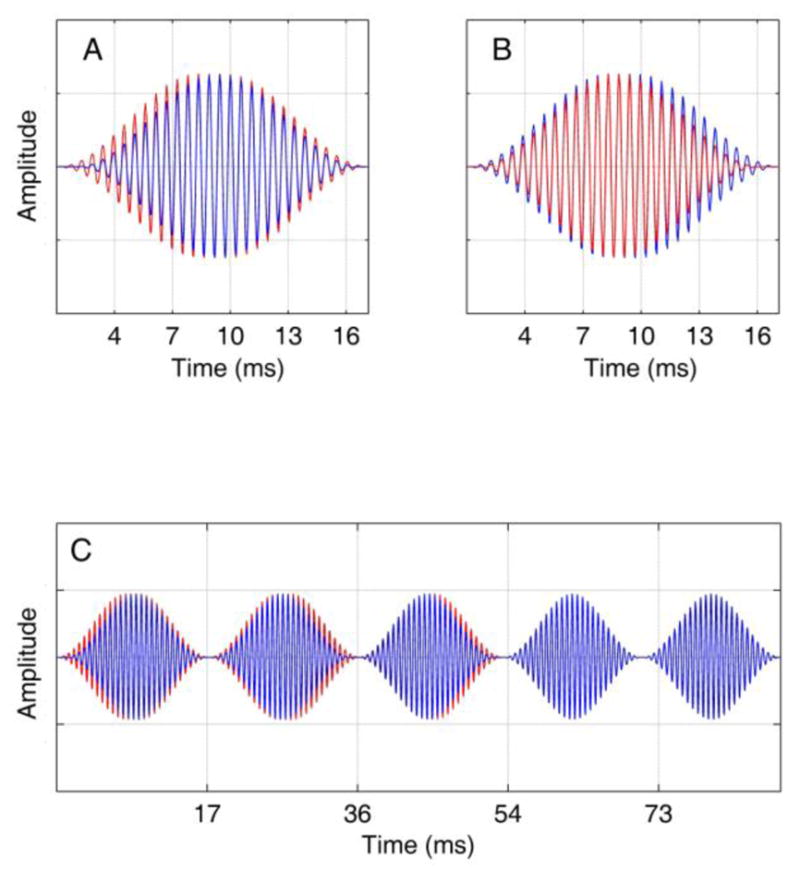
Figure 6.

Panels A and B represent the types of modulation cycles used in experiments 2 and 3 in which interaural delays were selected on each trial from a normal distribution separately for the positive and negative slopes. Panel A shows a sample modulation cycle with ITDs of +450 and −200 μs in the positive and negative slopes respectively, and panel B shows ITDs of −210 and +435 μs. The delays shown in this figure are larger than those used in the experiment to facilitate visual inspection. Panel C shows the first five cycles of a representative waveform used in experiment 3, with the first 3 cycles dichotic and the next two diotic (zero ITD).
