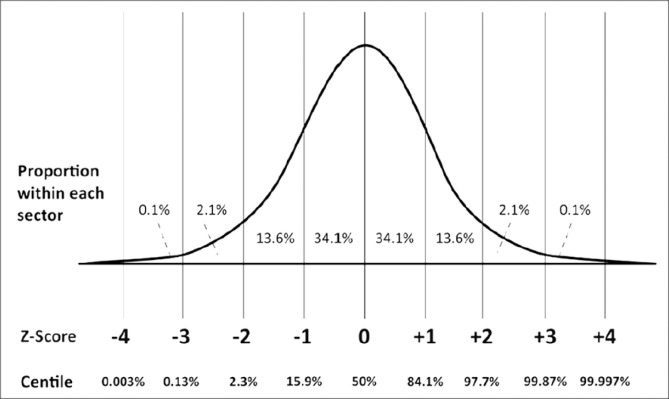
Figure 1.
A schematic diagram depicting the relationship between Z-scores and centiles, where the parameter is normally distrubuted.2 At extreme values, (>3 standard deviations from the mean), the centile remains fairly constant, but the Z-score remains sensitive to changes in measurements. Included with permission from Chubb et al. [2].

